in reverse cron order. see also: my map of the week
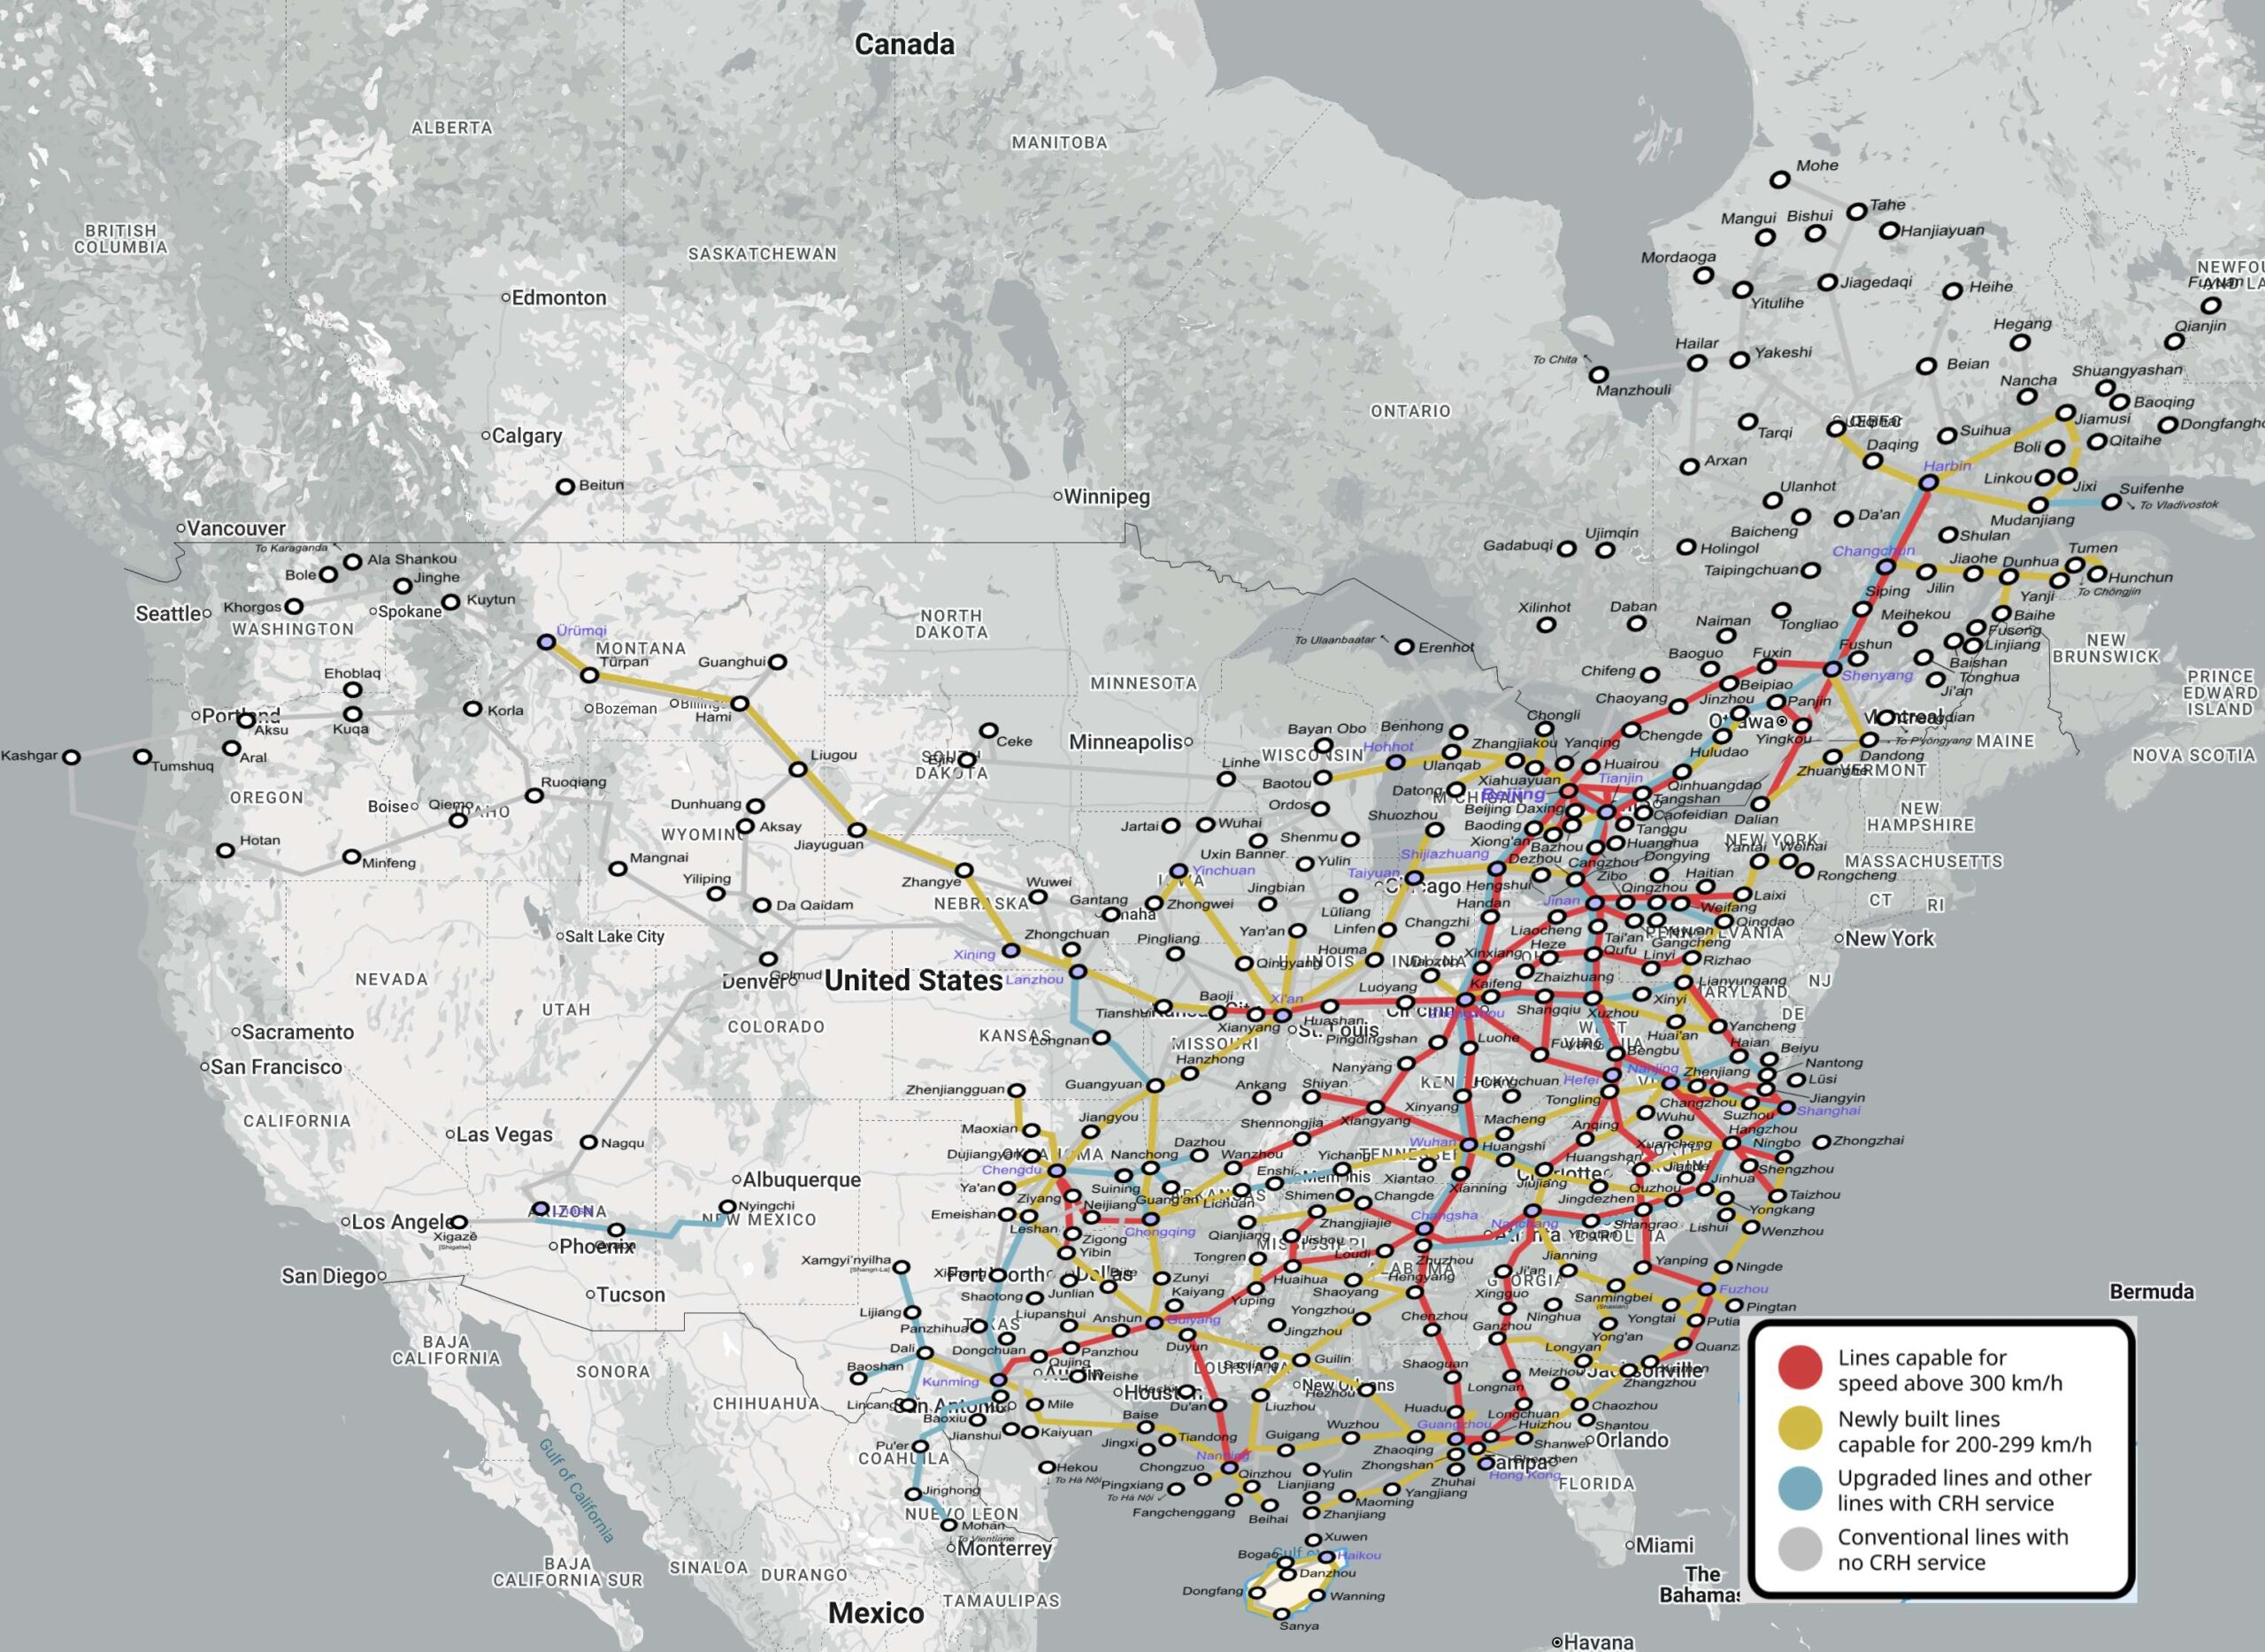
— 2026-03-02 – Monday – China’s high speed rail network overlaid on North America
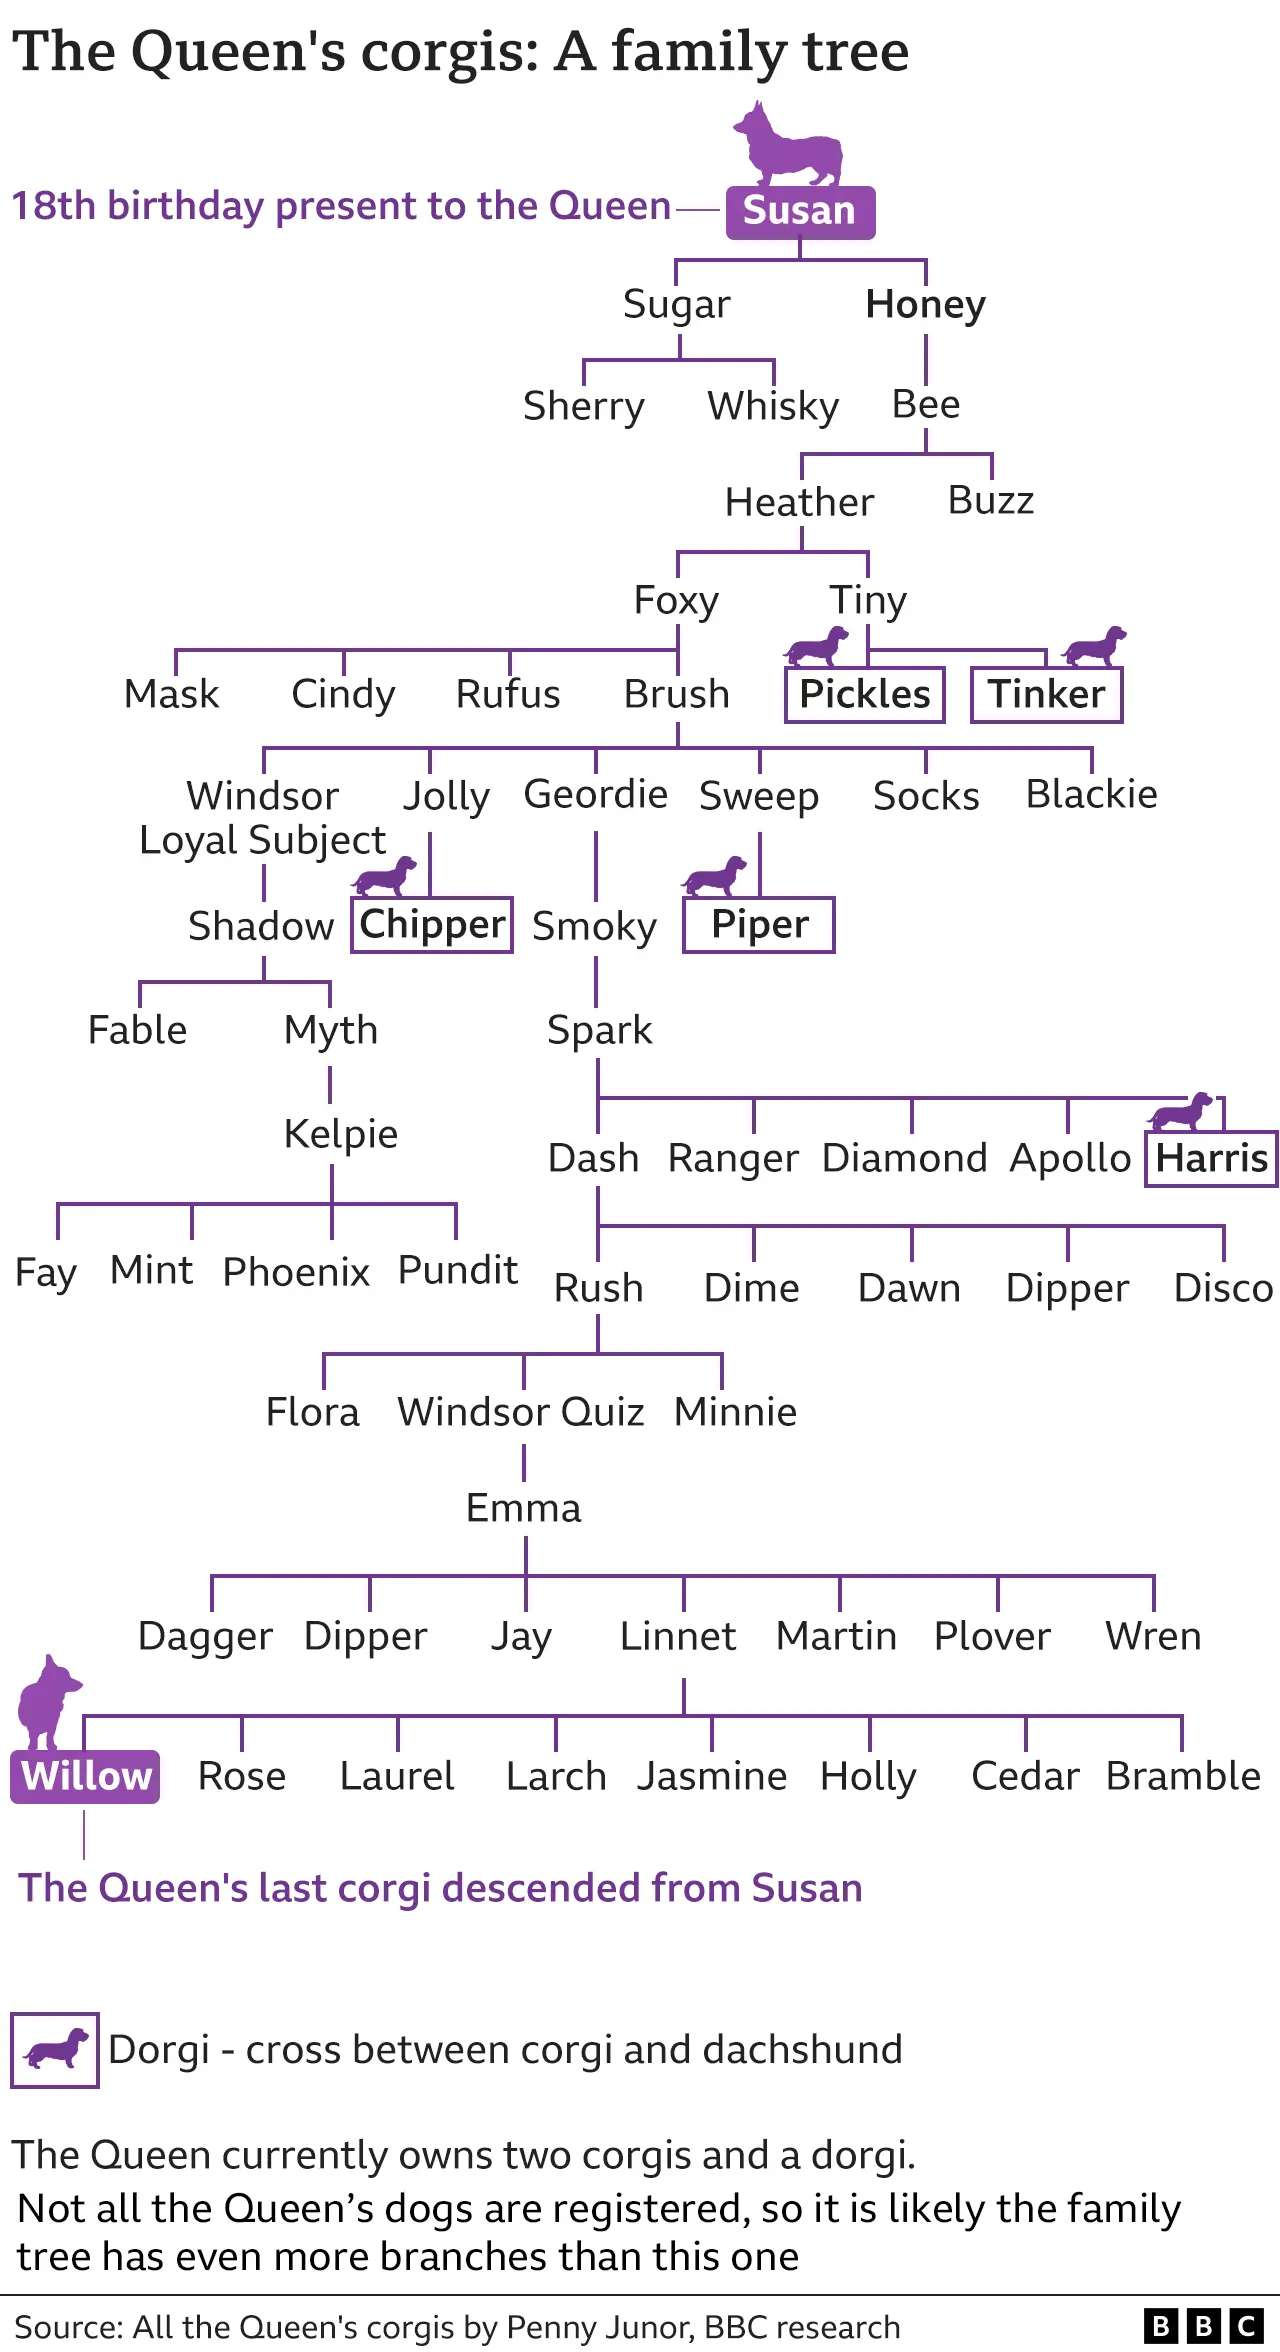
— 2026-03-02 – Monday – Queen Elizabeth’s Corgis – A Family Tree
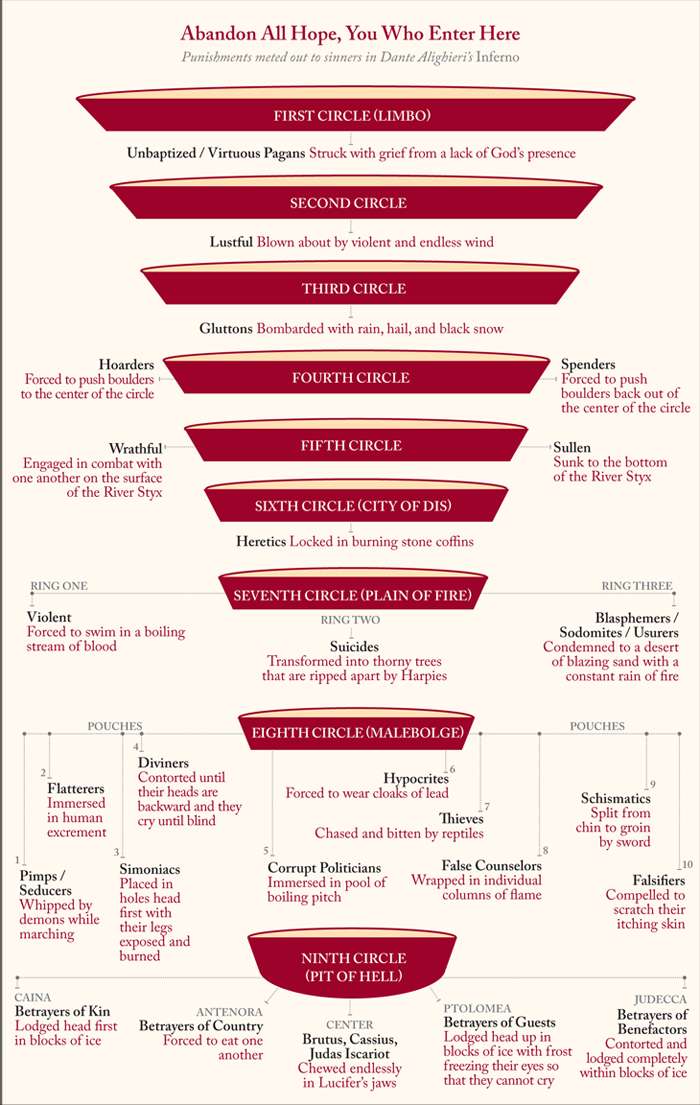
— 2026-01-13 – Tuesday – the best Dante’s “9 Layers of Hell”.
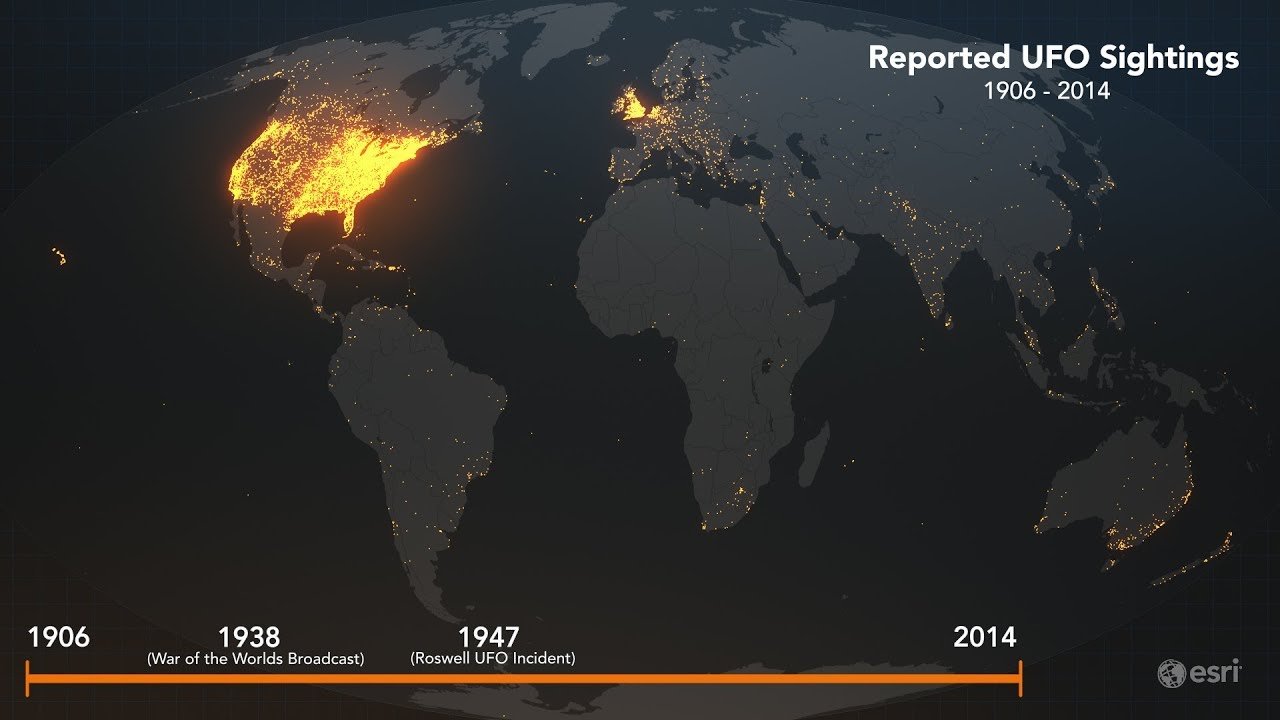
— 2025-08-21 – Thursday – interesting that its so prevalent in english-speaking. would be cool to see it animated ; i believe the ~1938 war of the worlds and the first alien movies in ?1950s likely caused big spikes.
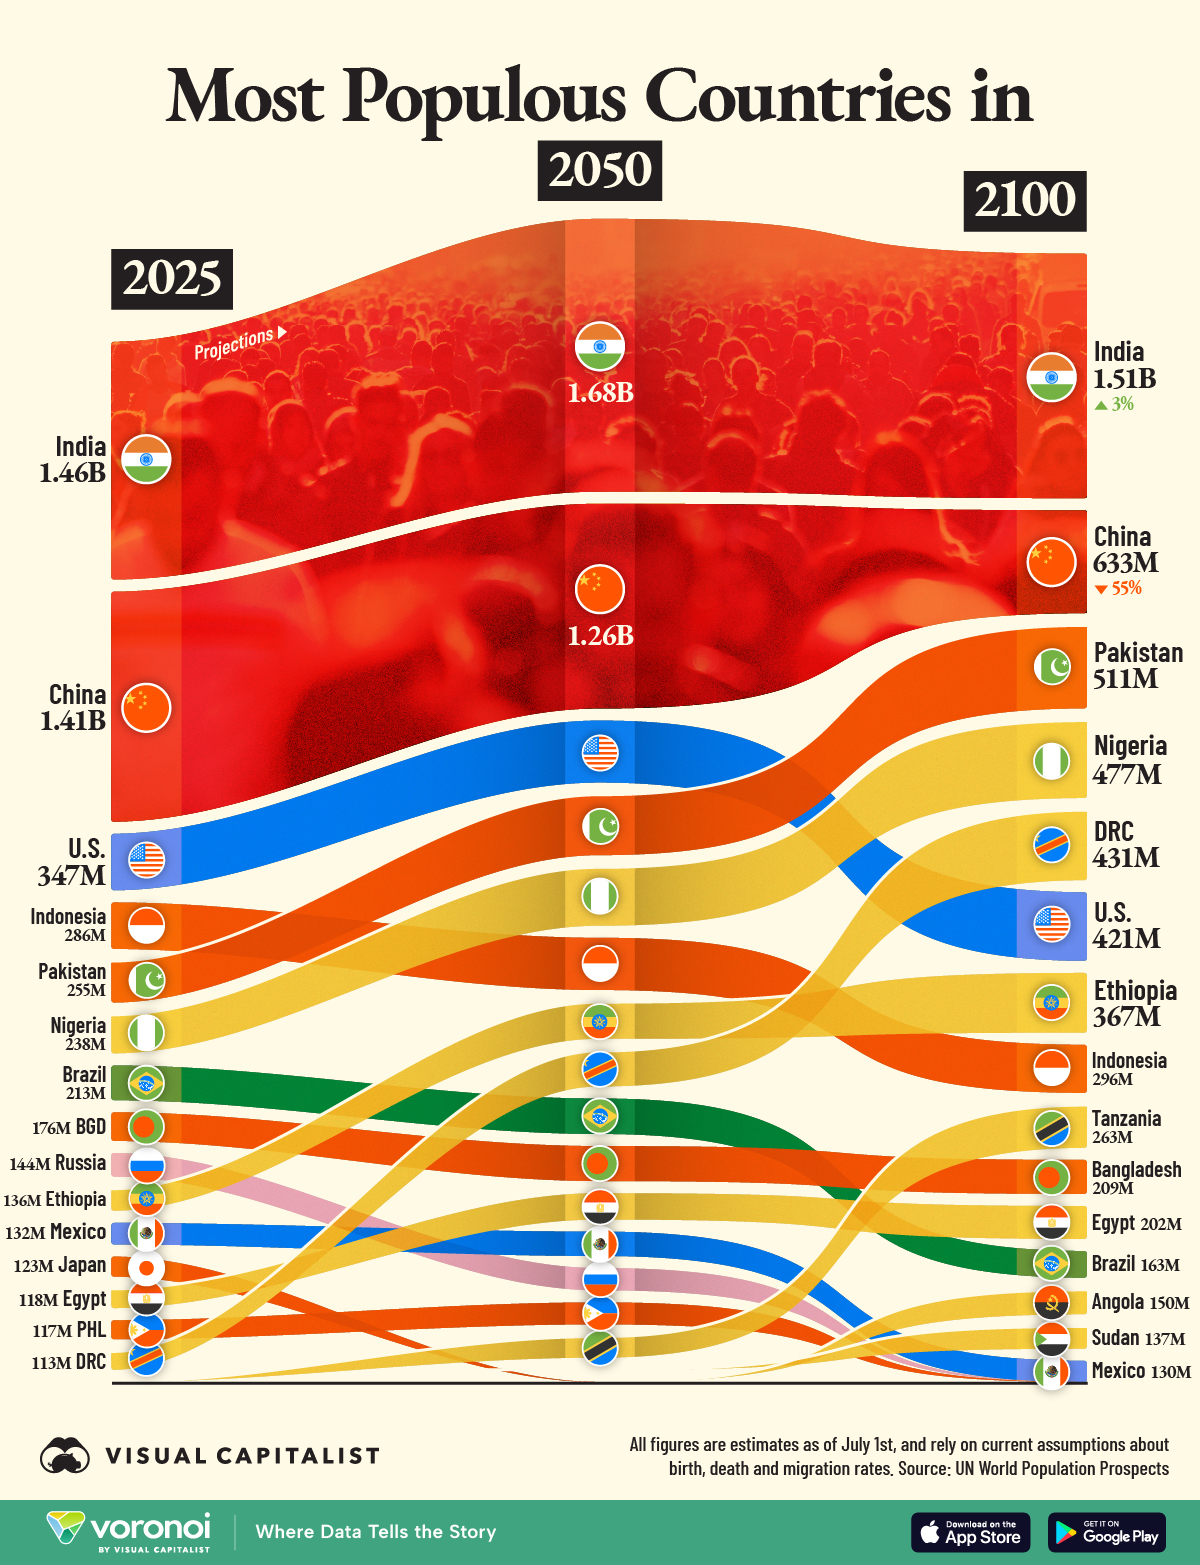
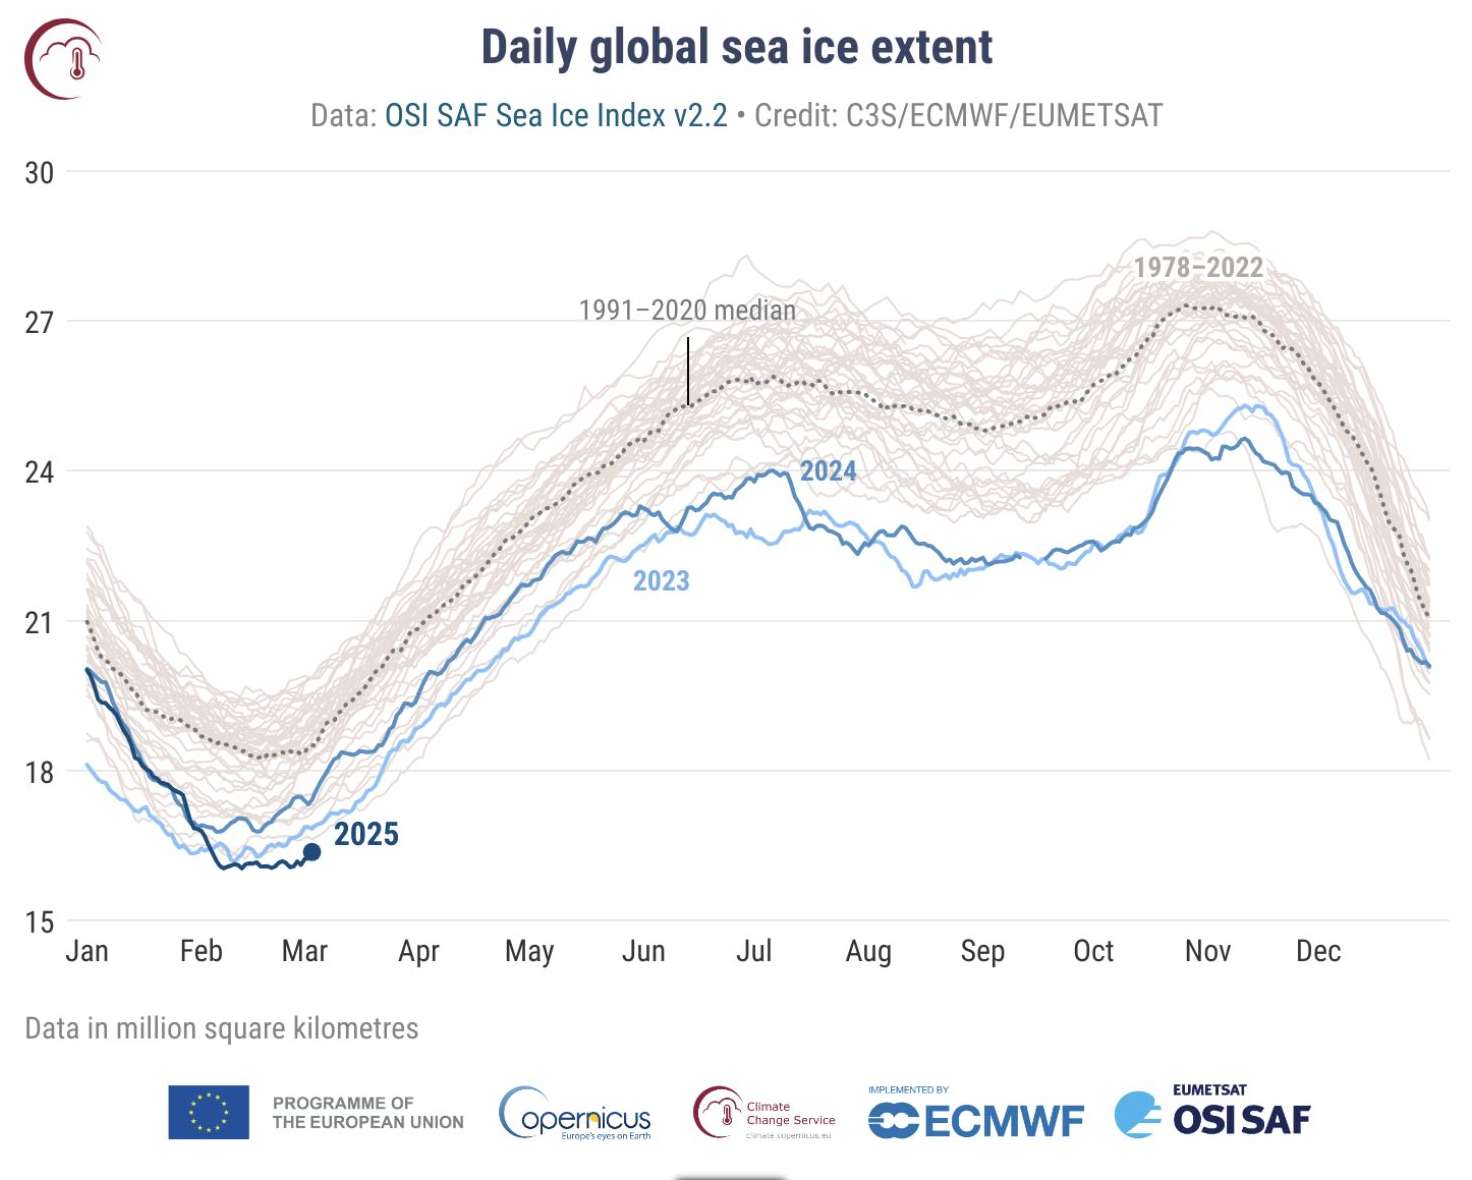
— 2025-06-06 – Friday – something about this chart bugs me… look at the usa, where they go from 347M to 421M, but what is the signif of the hump in the middle (2050). seems to me it would be simpler to just go straight across with each entry. but then it wouldn’t be so curvy and perhaps that’s why i like it so much. or just show the delta% from the start? and why %change only for India, China? the %change is a much more information number. me thinks.
— 2025-05-04 – Sunday
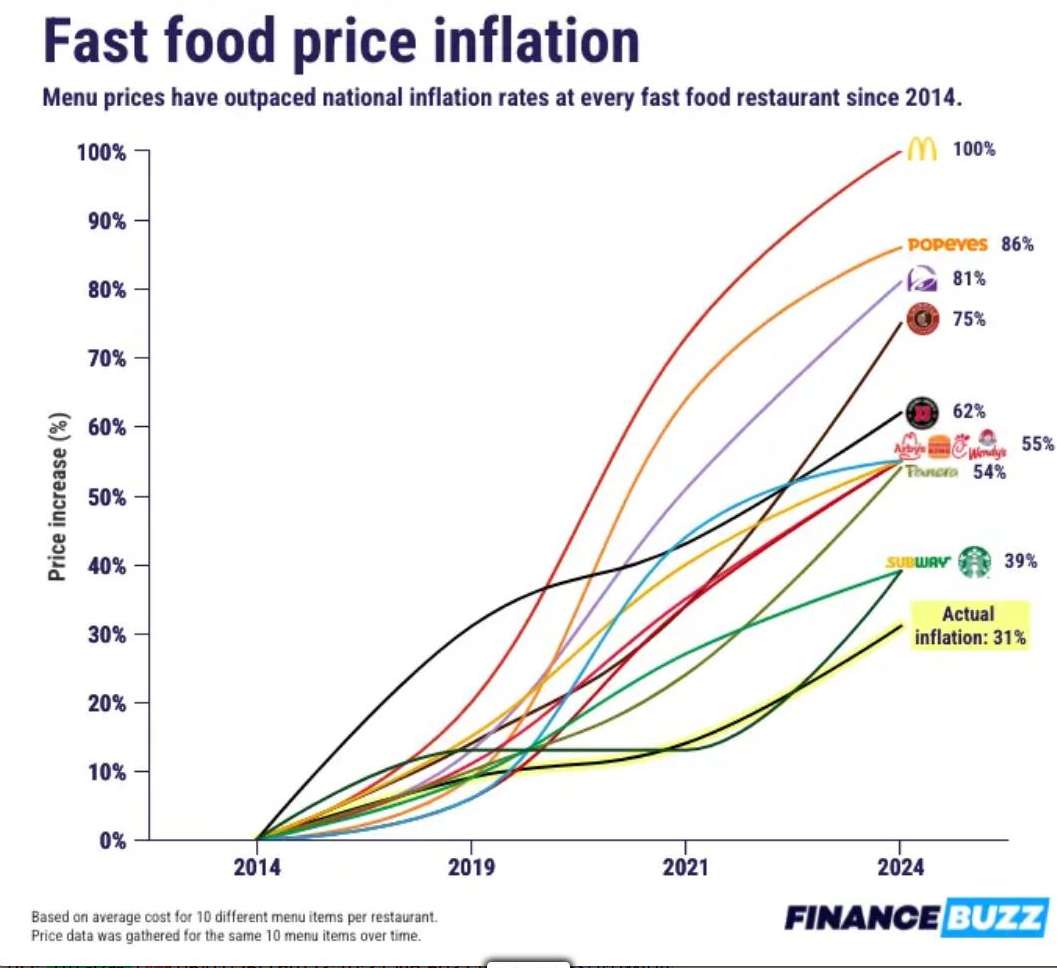
interesting the lowest cost places (McD, Taco Bell) are the biggest inflation numbers.
— 2025-03-19 – Wednesday
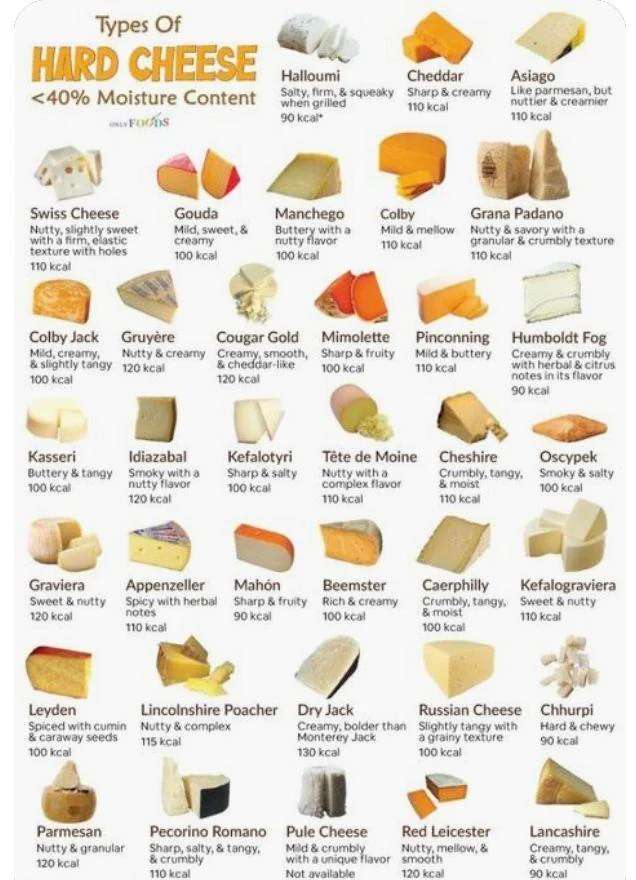
this might be important…
and type of hard cheese. cause cheese.
— 2025-03-11 – Tuesday
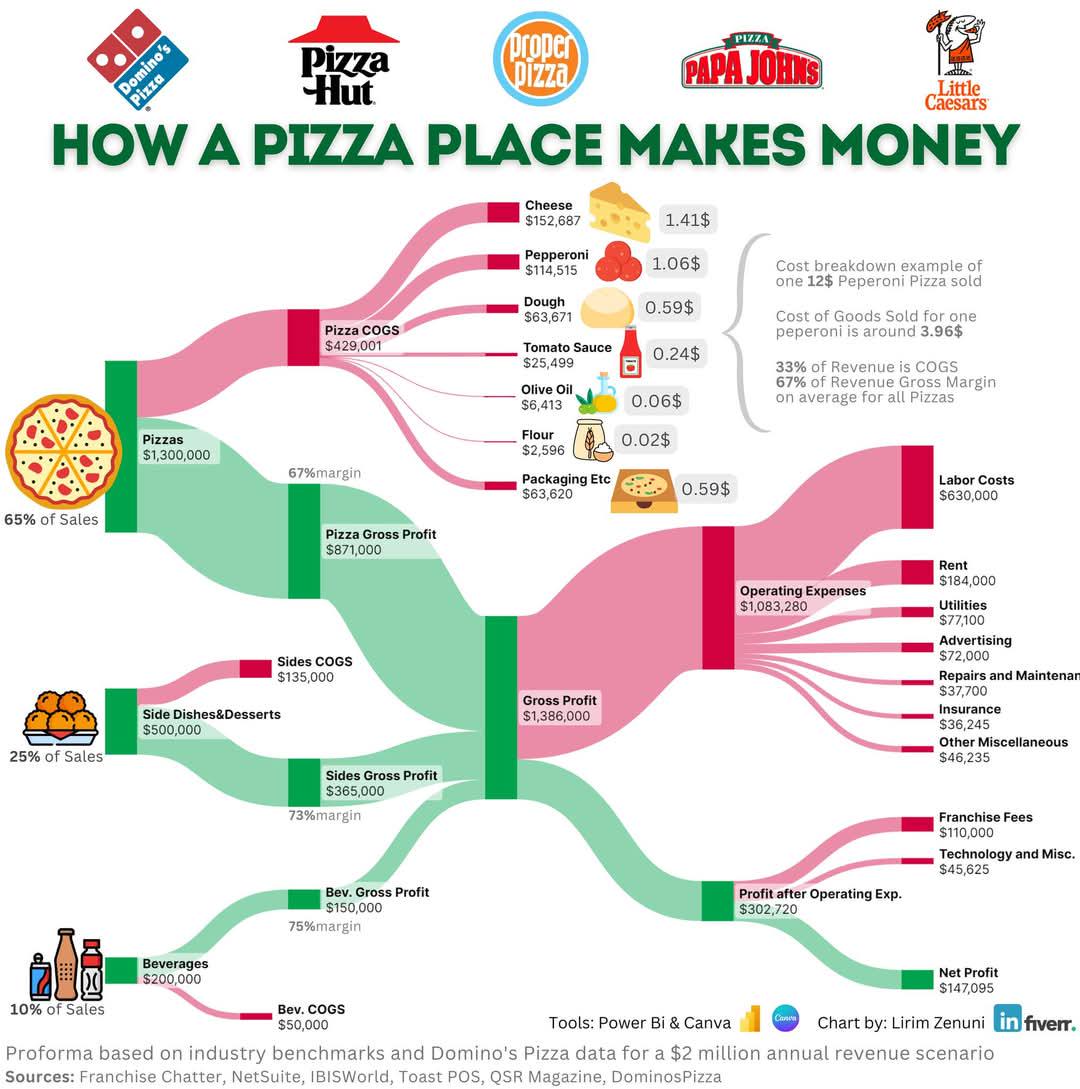
mmmm… labour costs are ~63% of gross profit? this seems higher than i was led to believe.
— 2025-02-08 – Saturday

— 2025-01-12 – Sunday
animated year-by-year hsr build; China way ahead; animated version really shows china talking off like a rocket in ~2007/8. ya ya, human rights issues, commies, etc. but holy fack they got some trains. recall the wuhan maintenance yard?

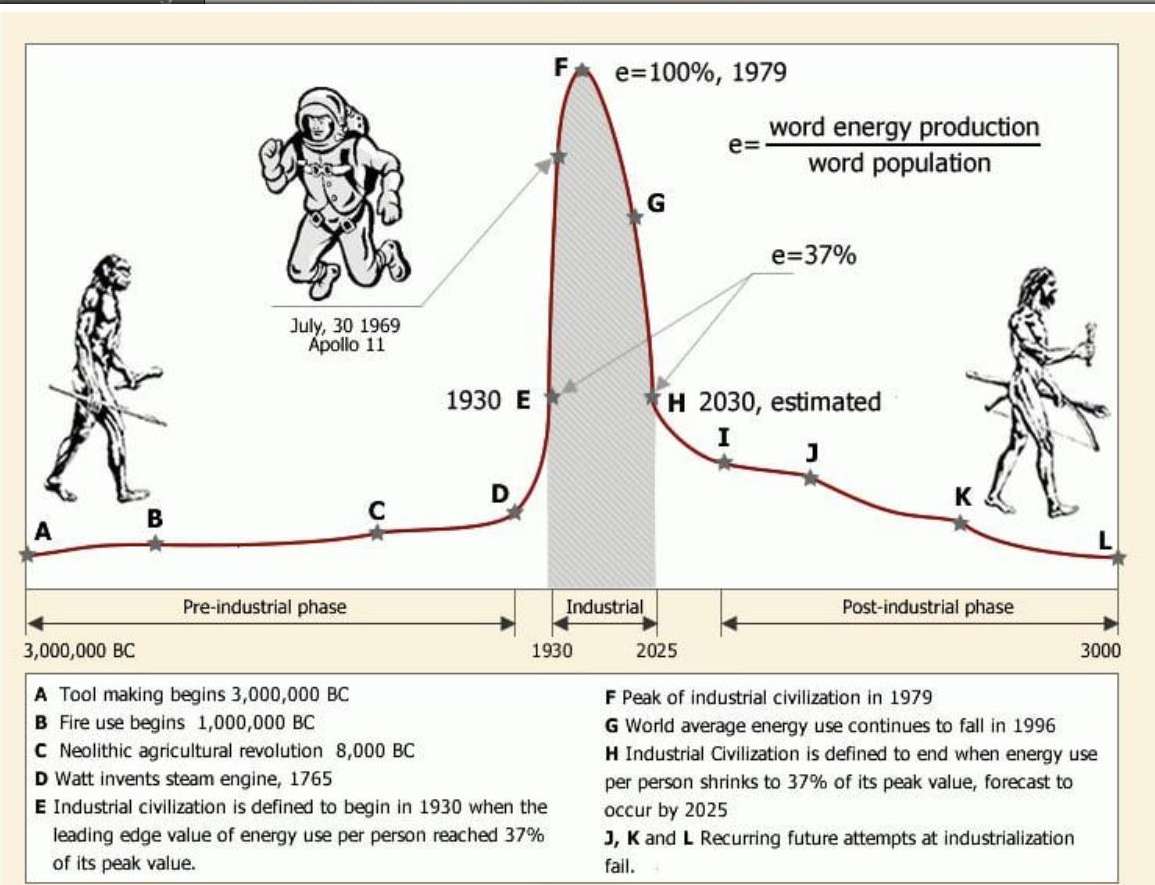
— 2025-01-17 – Tuesday – something about world energy production vs word population, some sort of measurement, when all the energy produced vs the population, mumble mumble. point e in the pic seems to explain it best. but as i try to write it i can’t get the words right.[6]
— 2025-01-02 – Thursday – a 2fer! breeds of chicken and breeds of ducks.


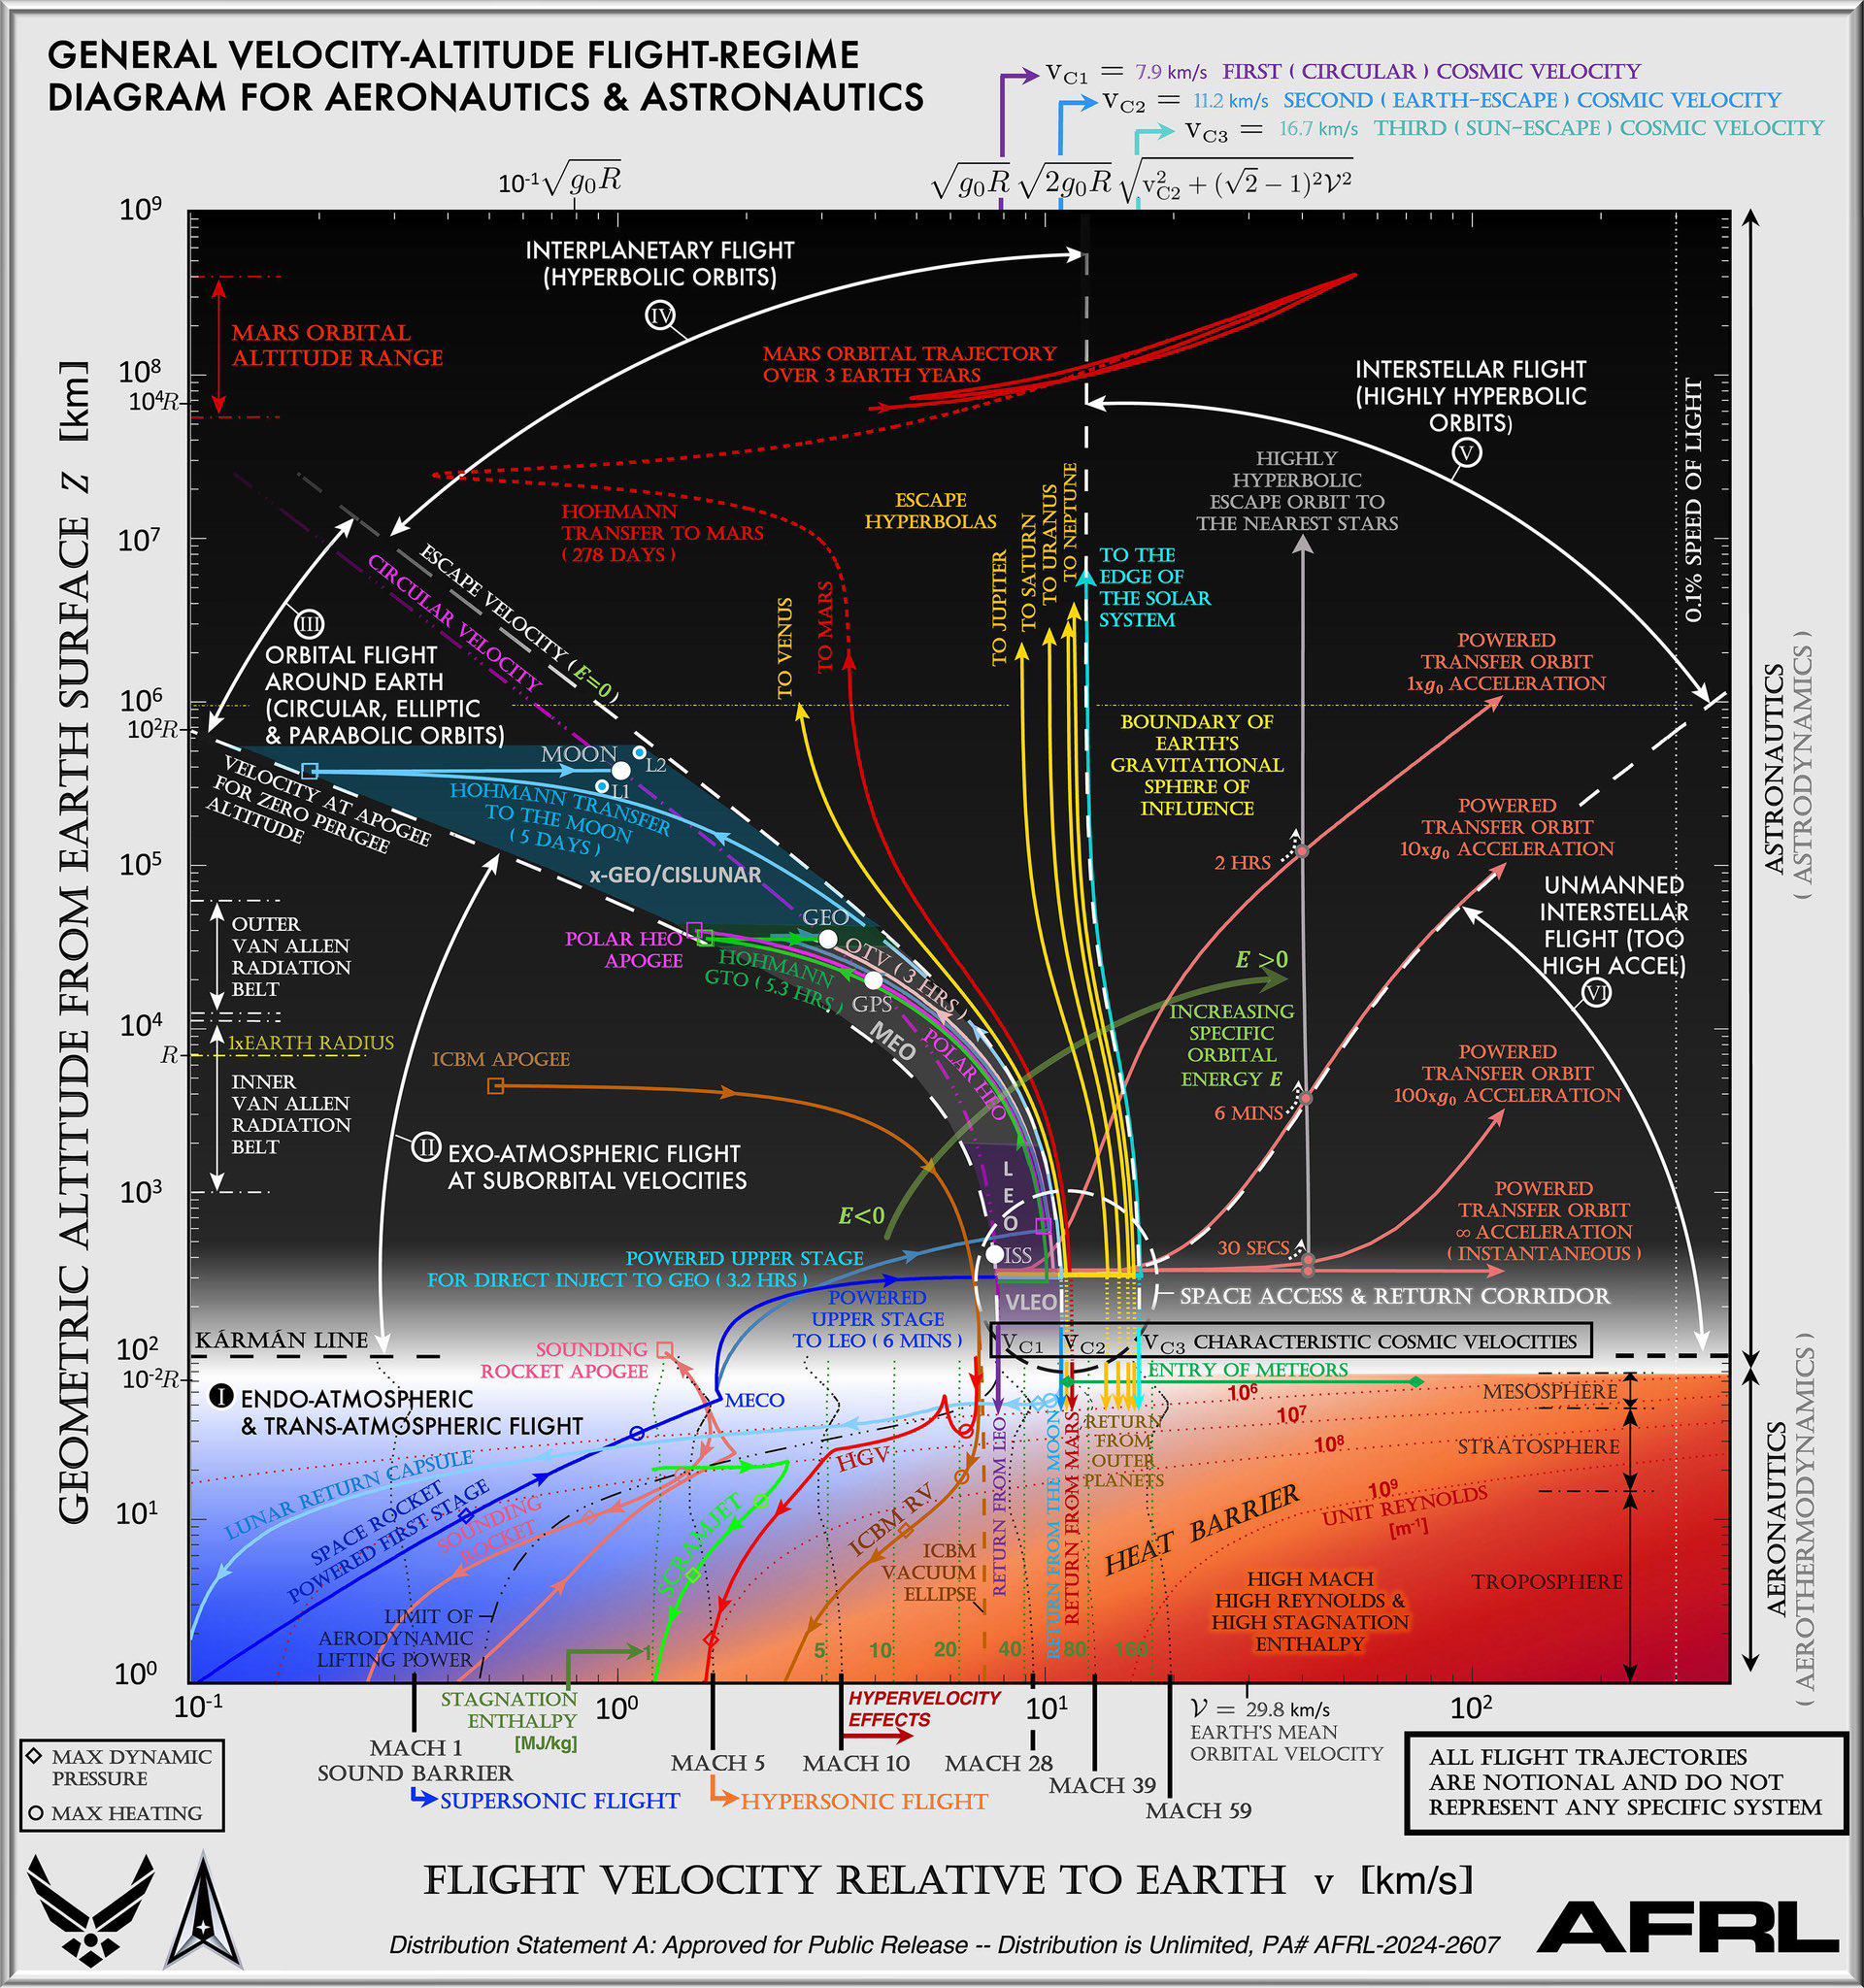
— 2024-12-14 – Saturday
i have no idea what most of this means. but i like it. probably explains why you can’t just go straight up?
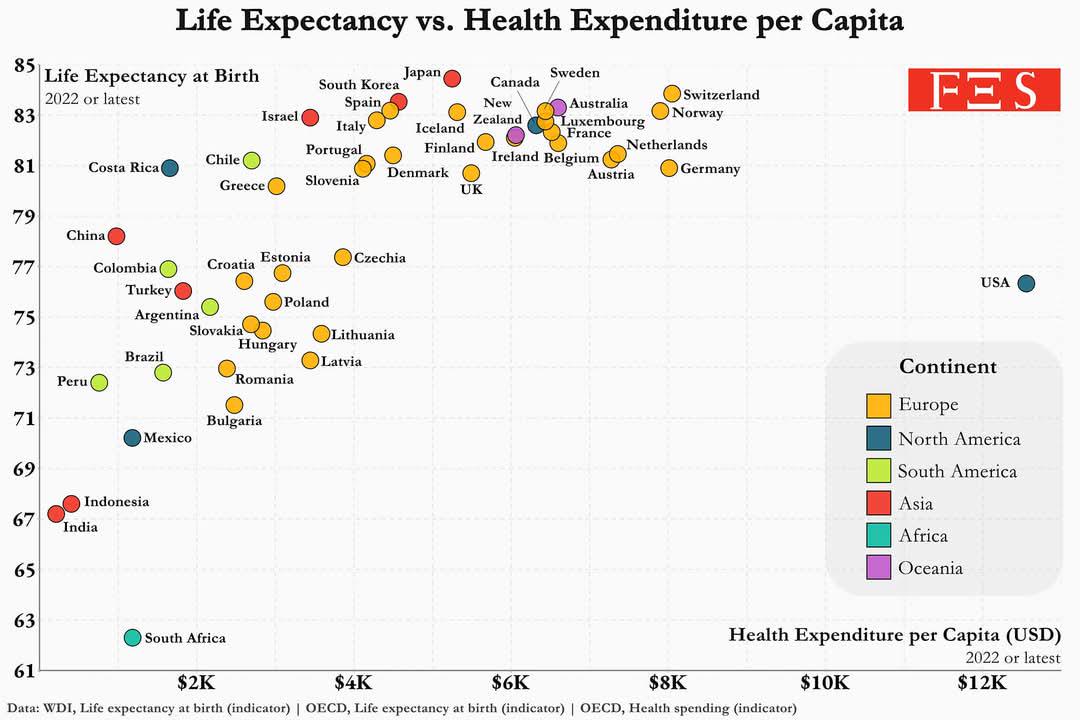
— 2024-12-07 – Saturday – chart-life-expectancy-vs-heath-expenditures-per-capita-by-country-
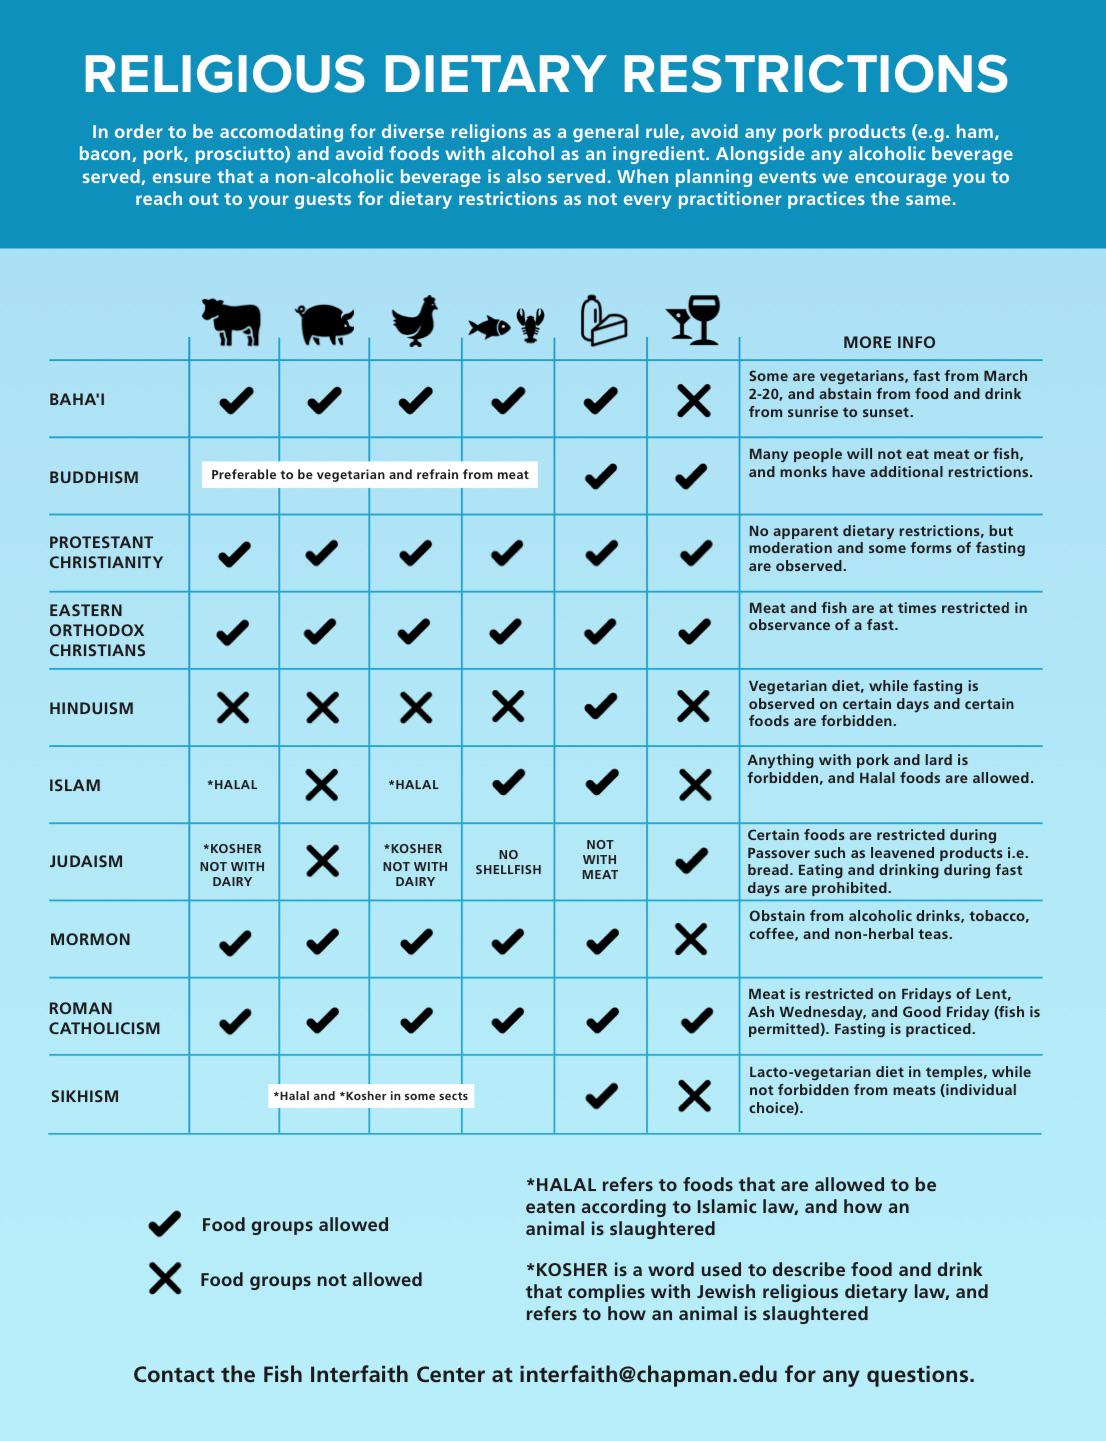
— 2024-11-25 – Monday – chart-religious-dietary-restrictions
— 2024-11-18 – Monday
— 2024-11-01 – Friday

— 2024-10-21 – Monday
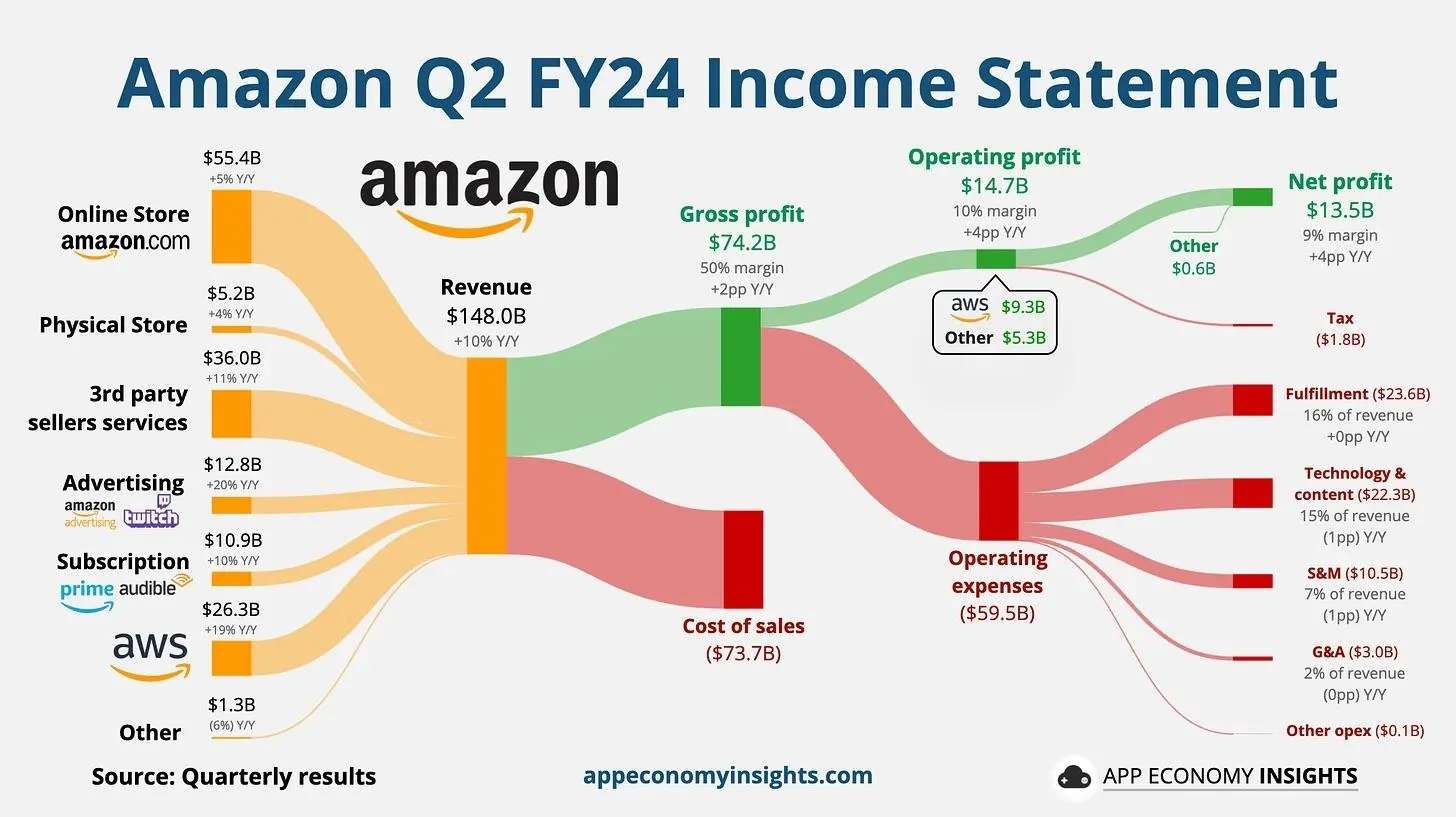
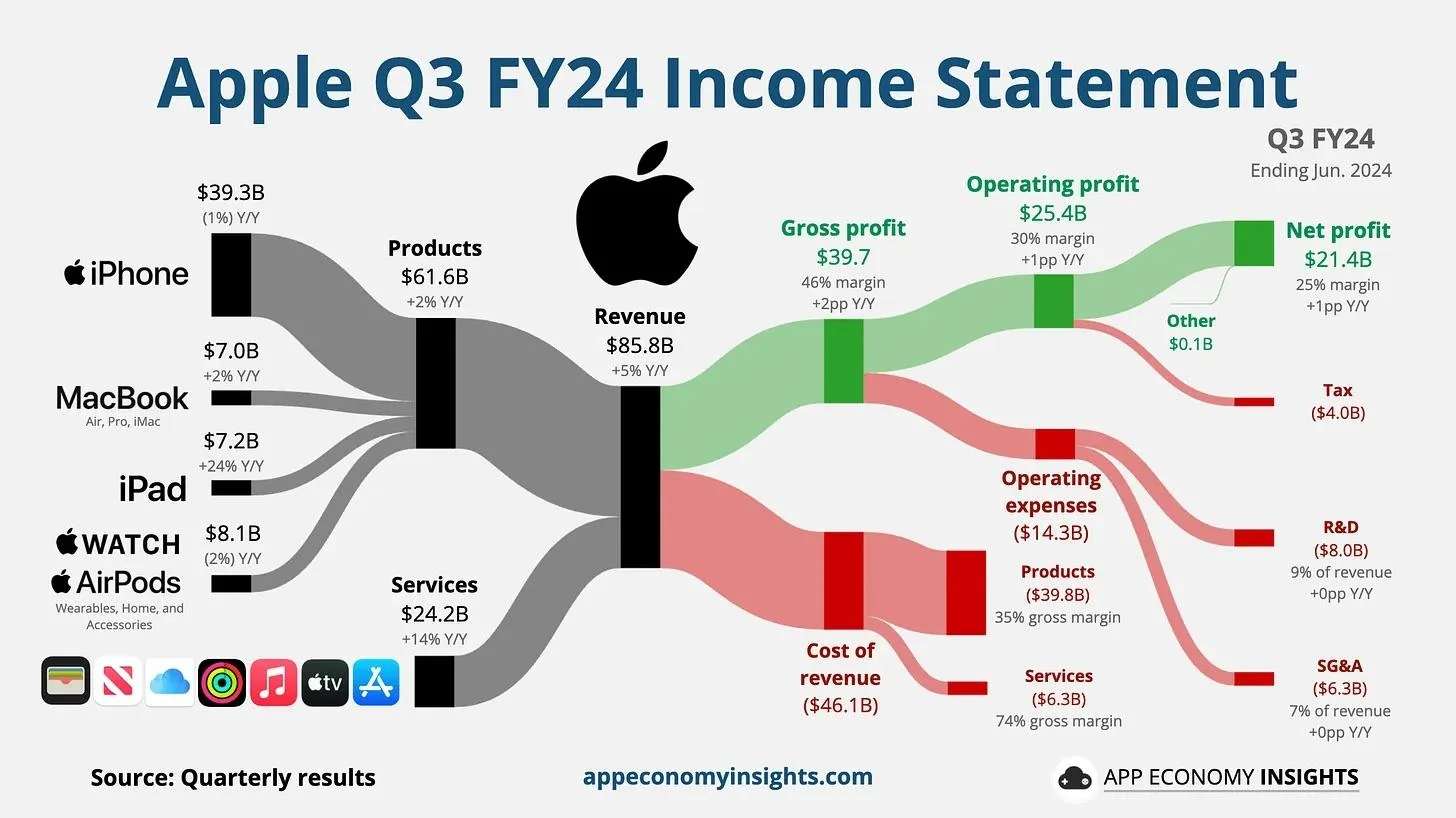
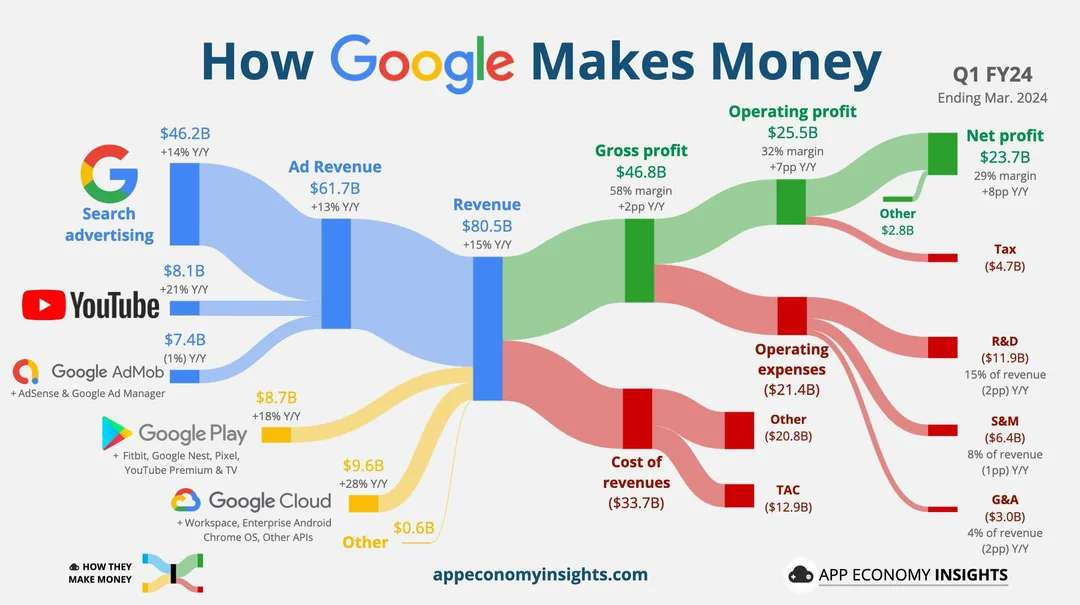
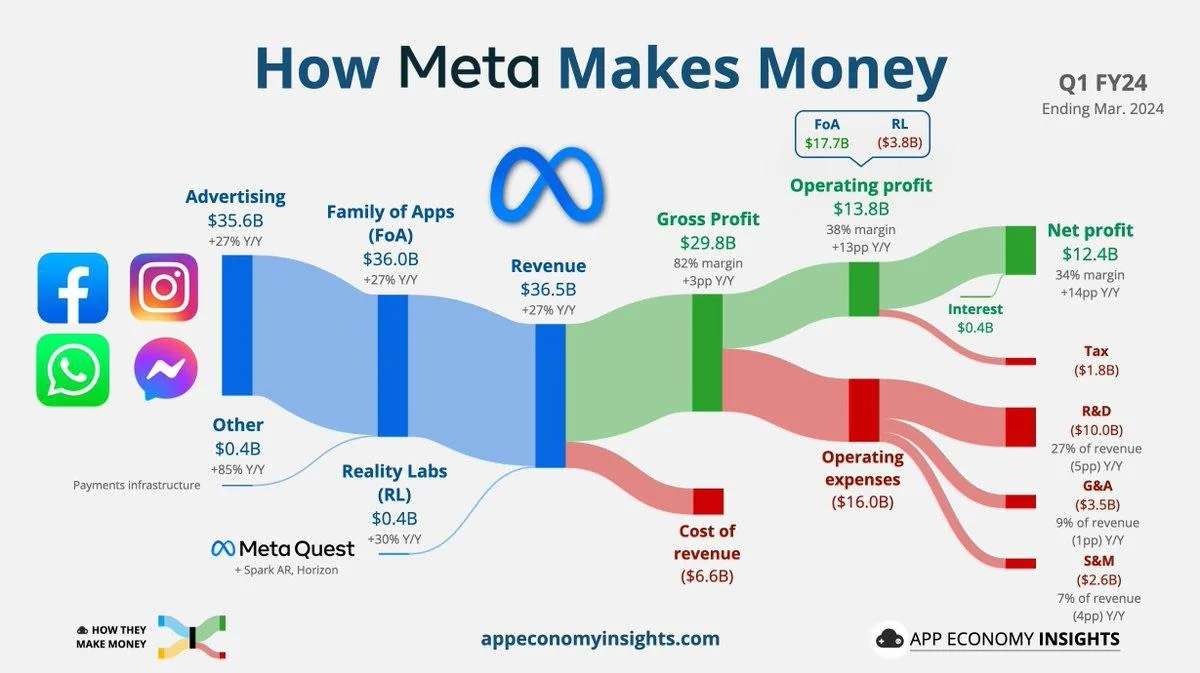
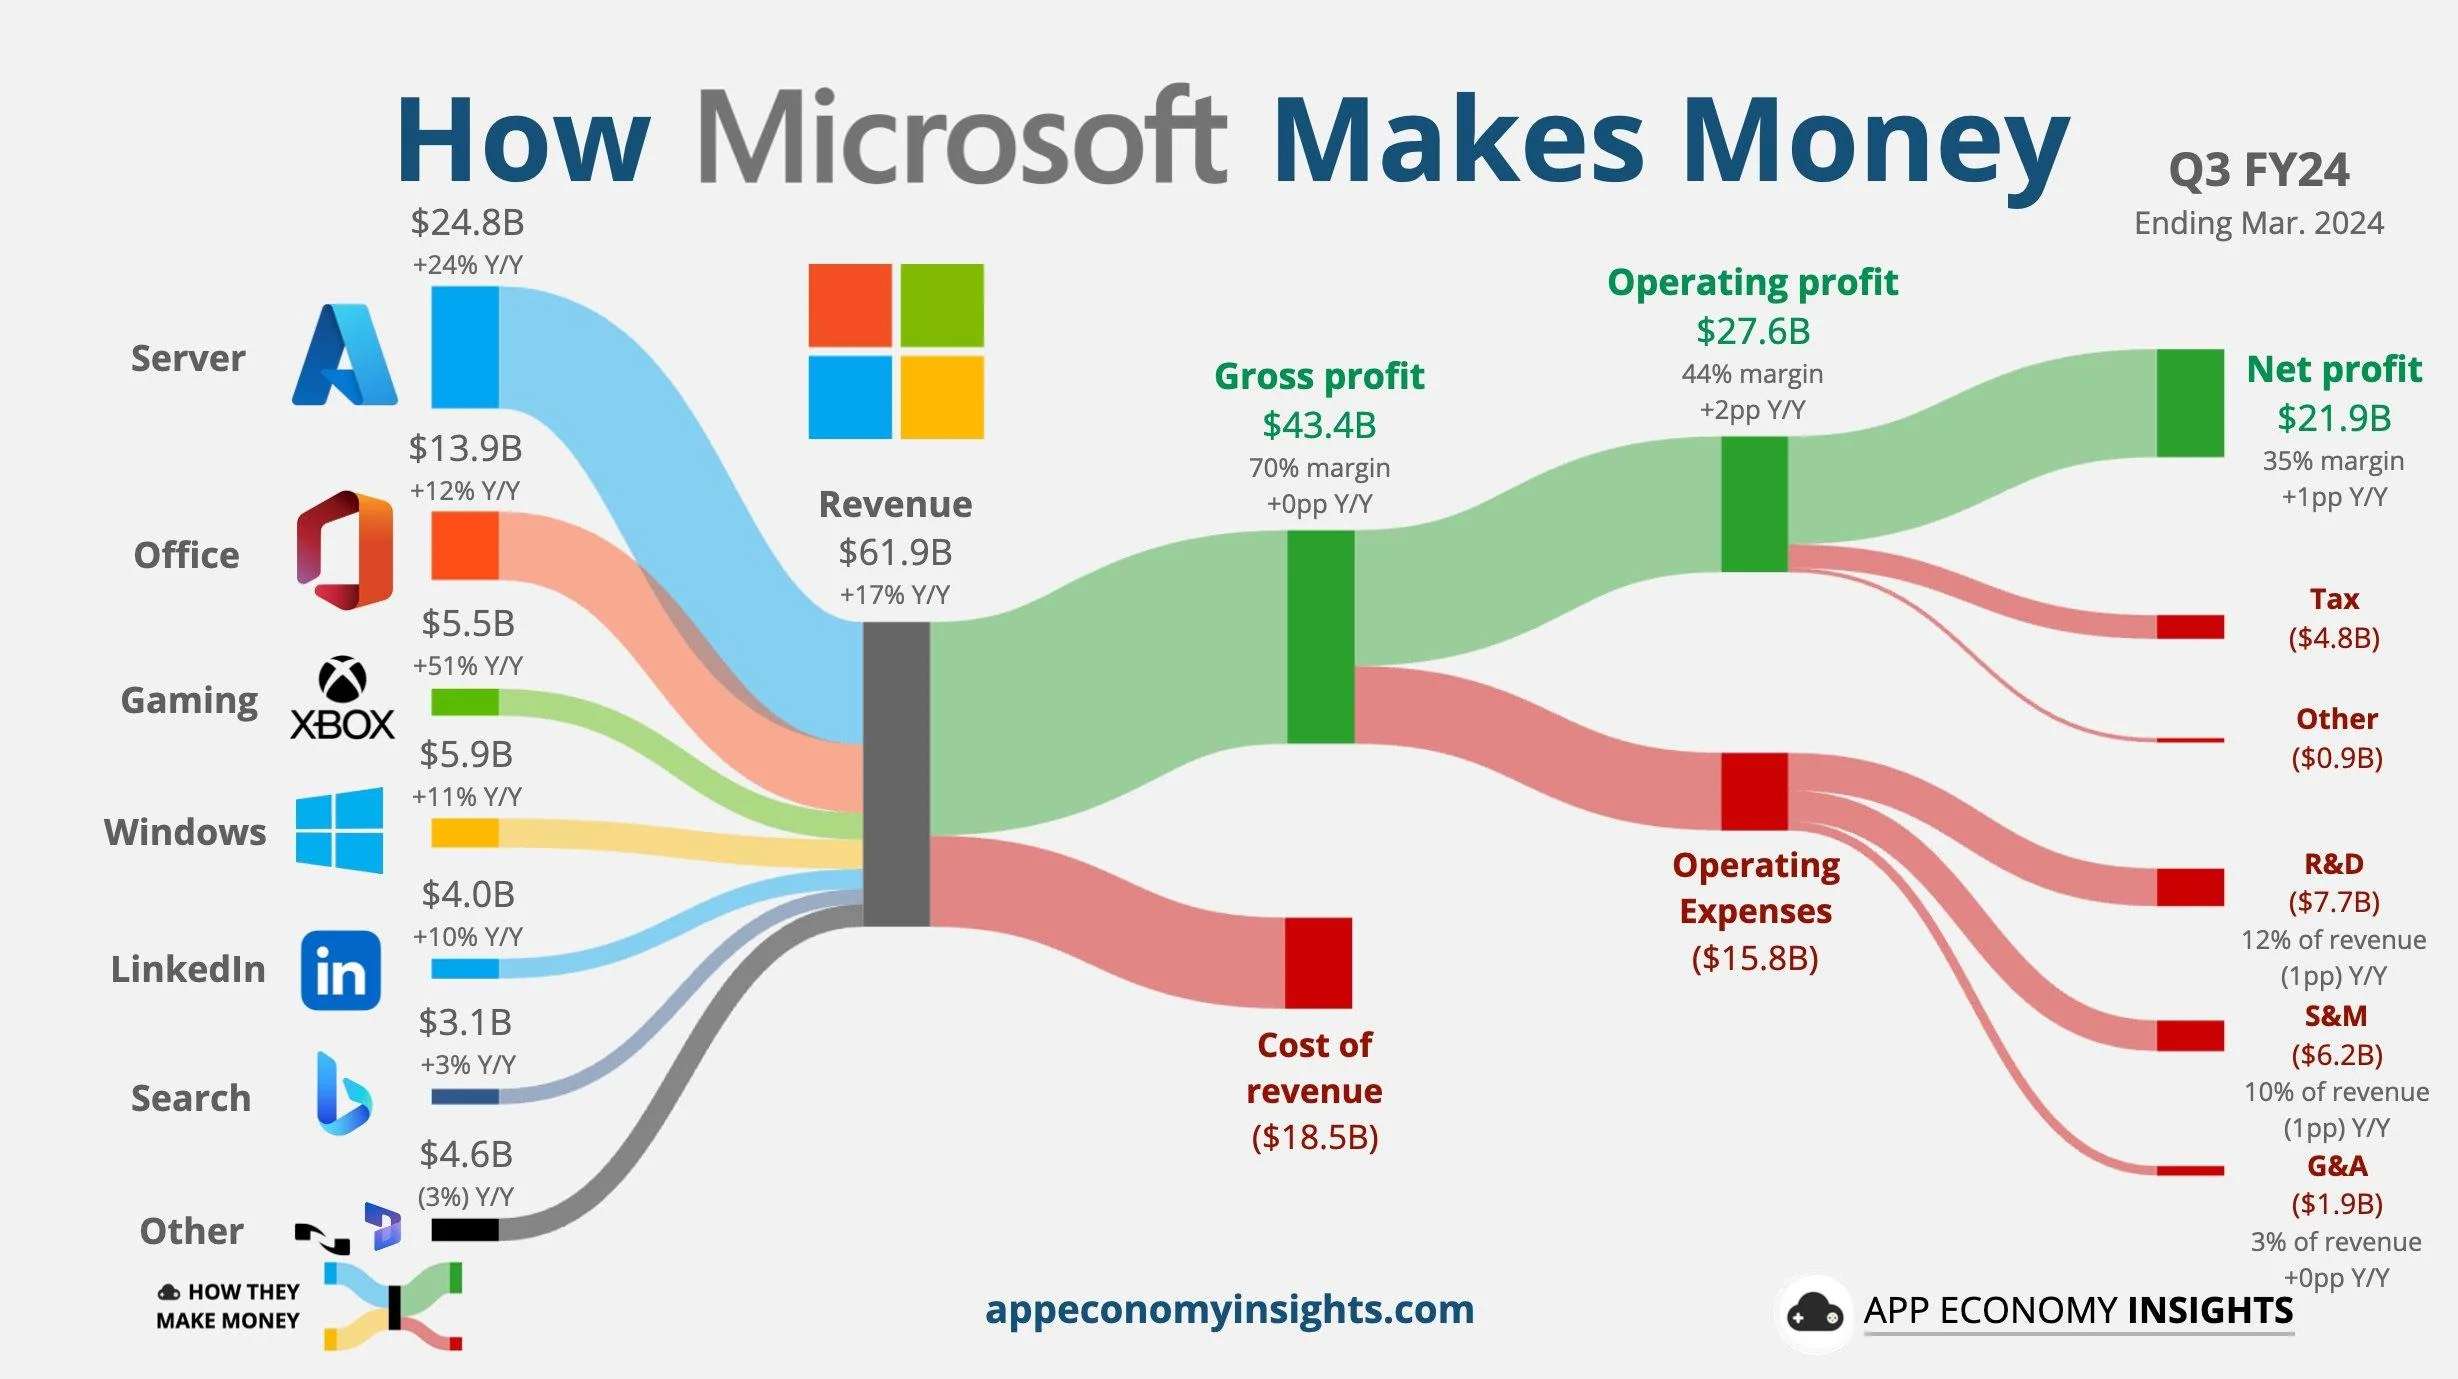
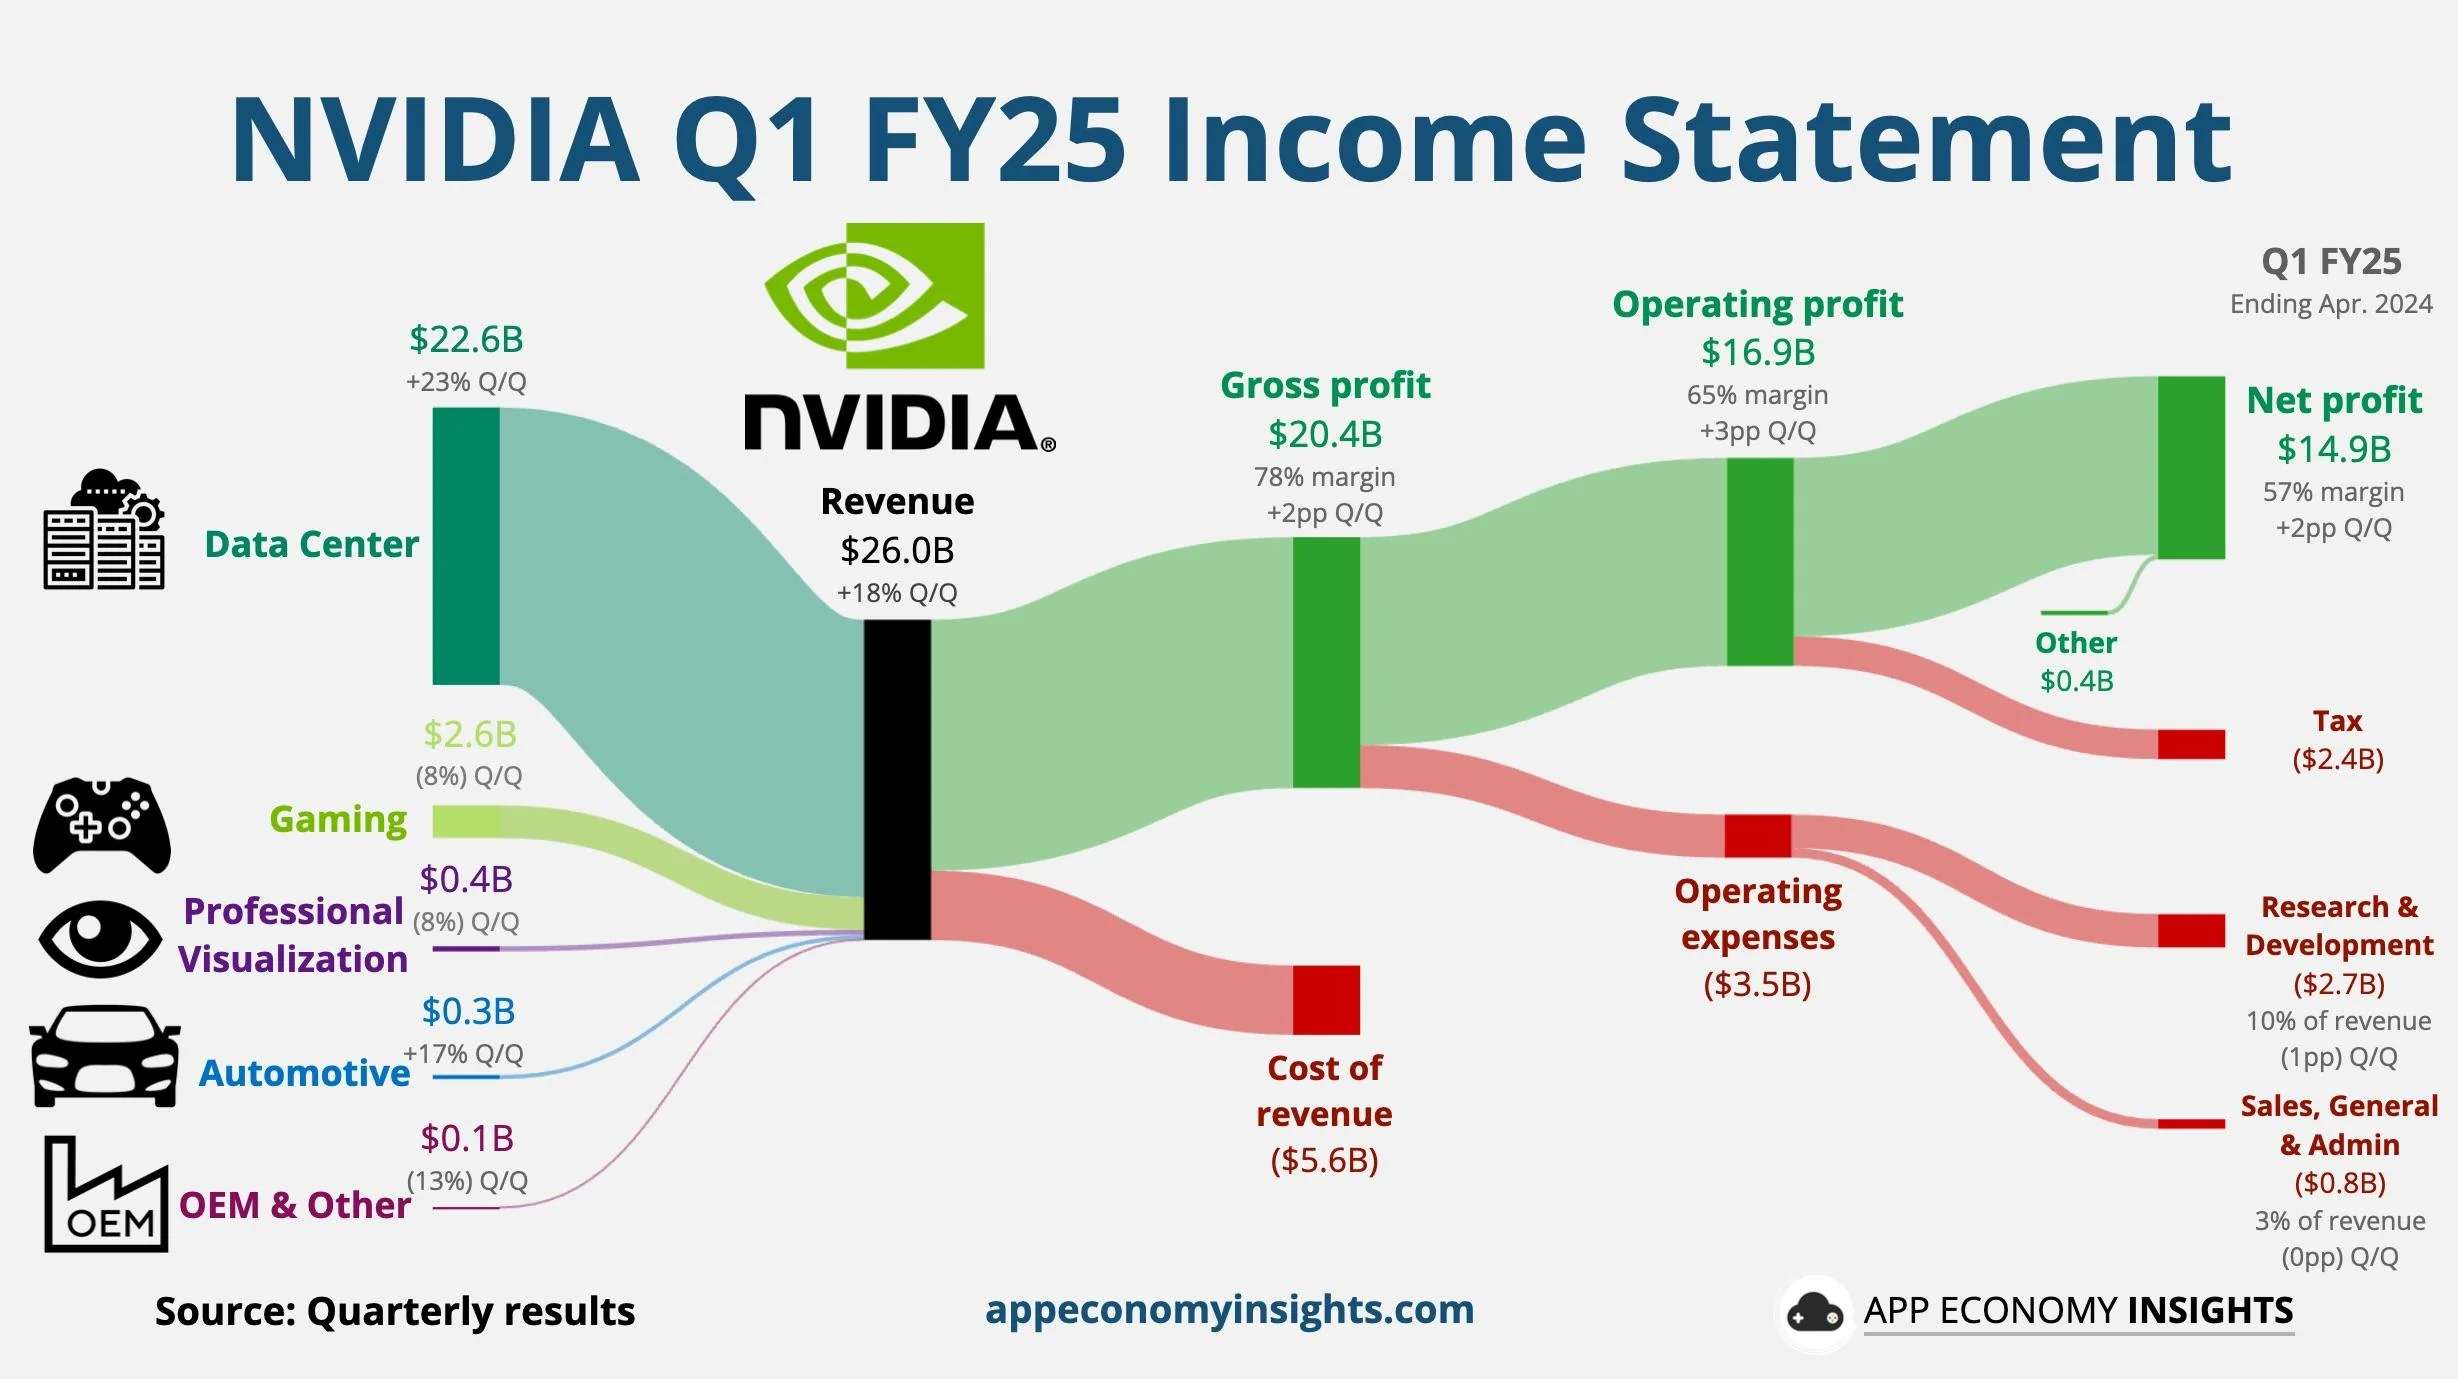
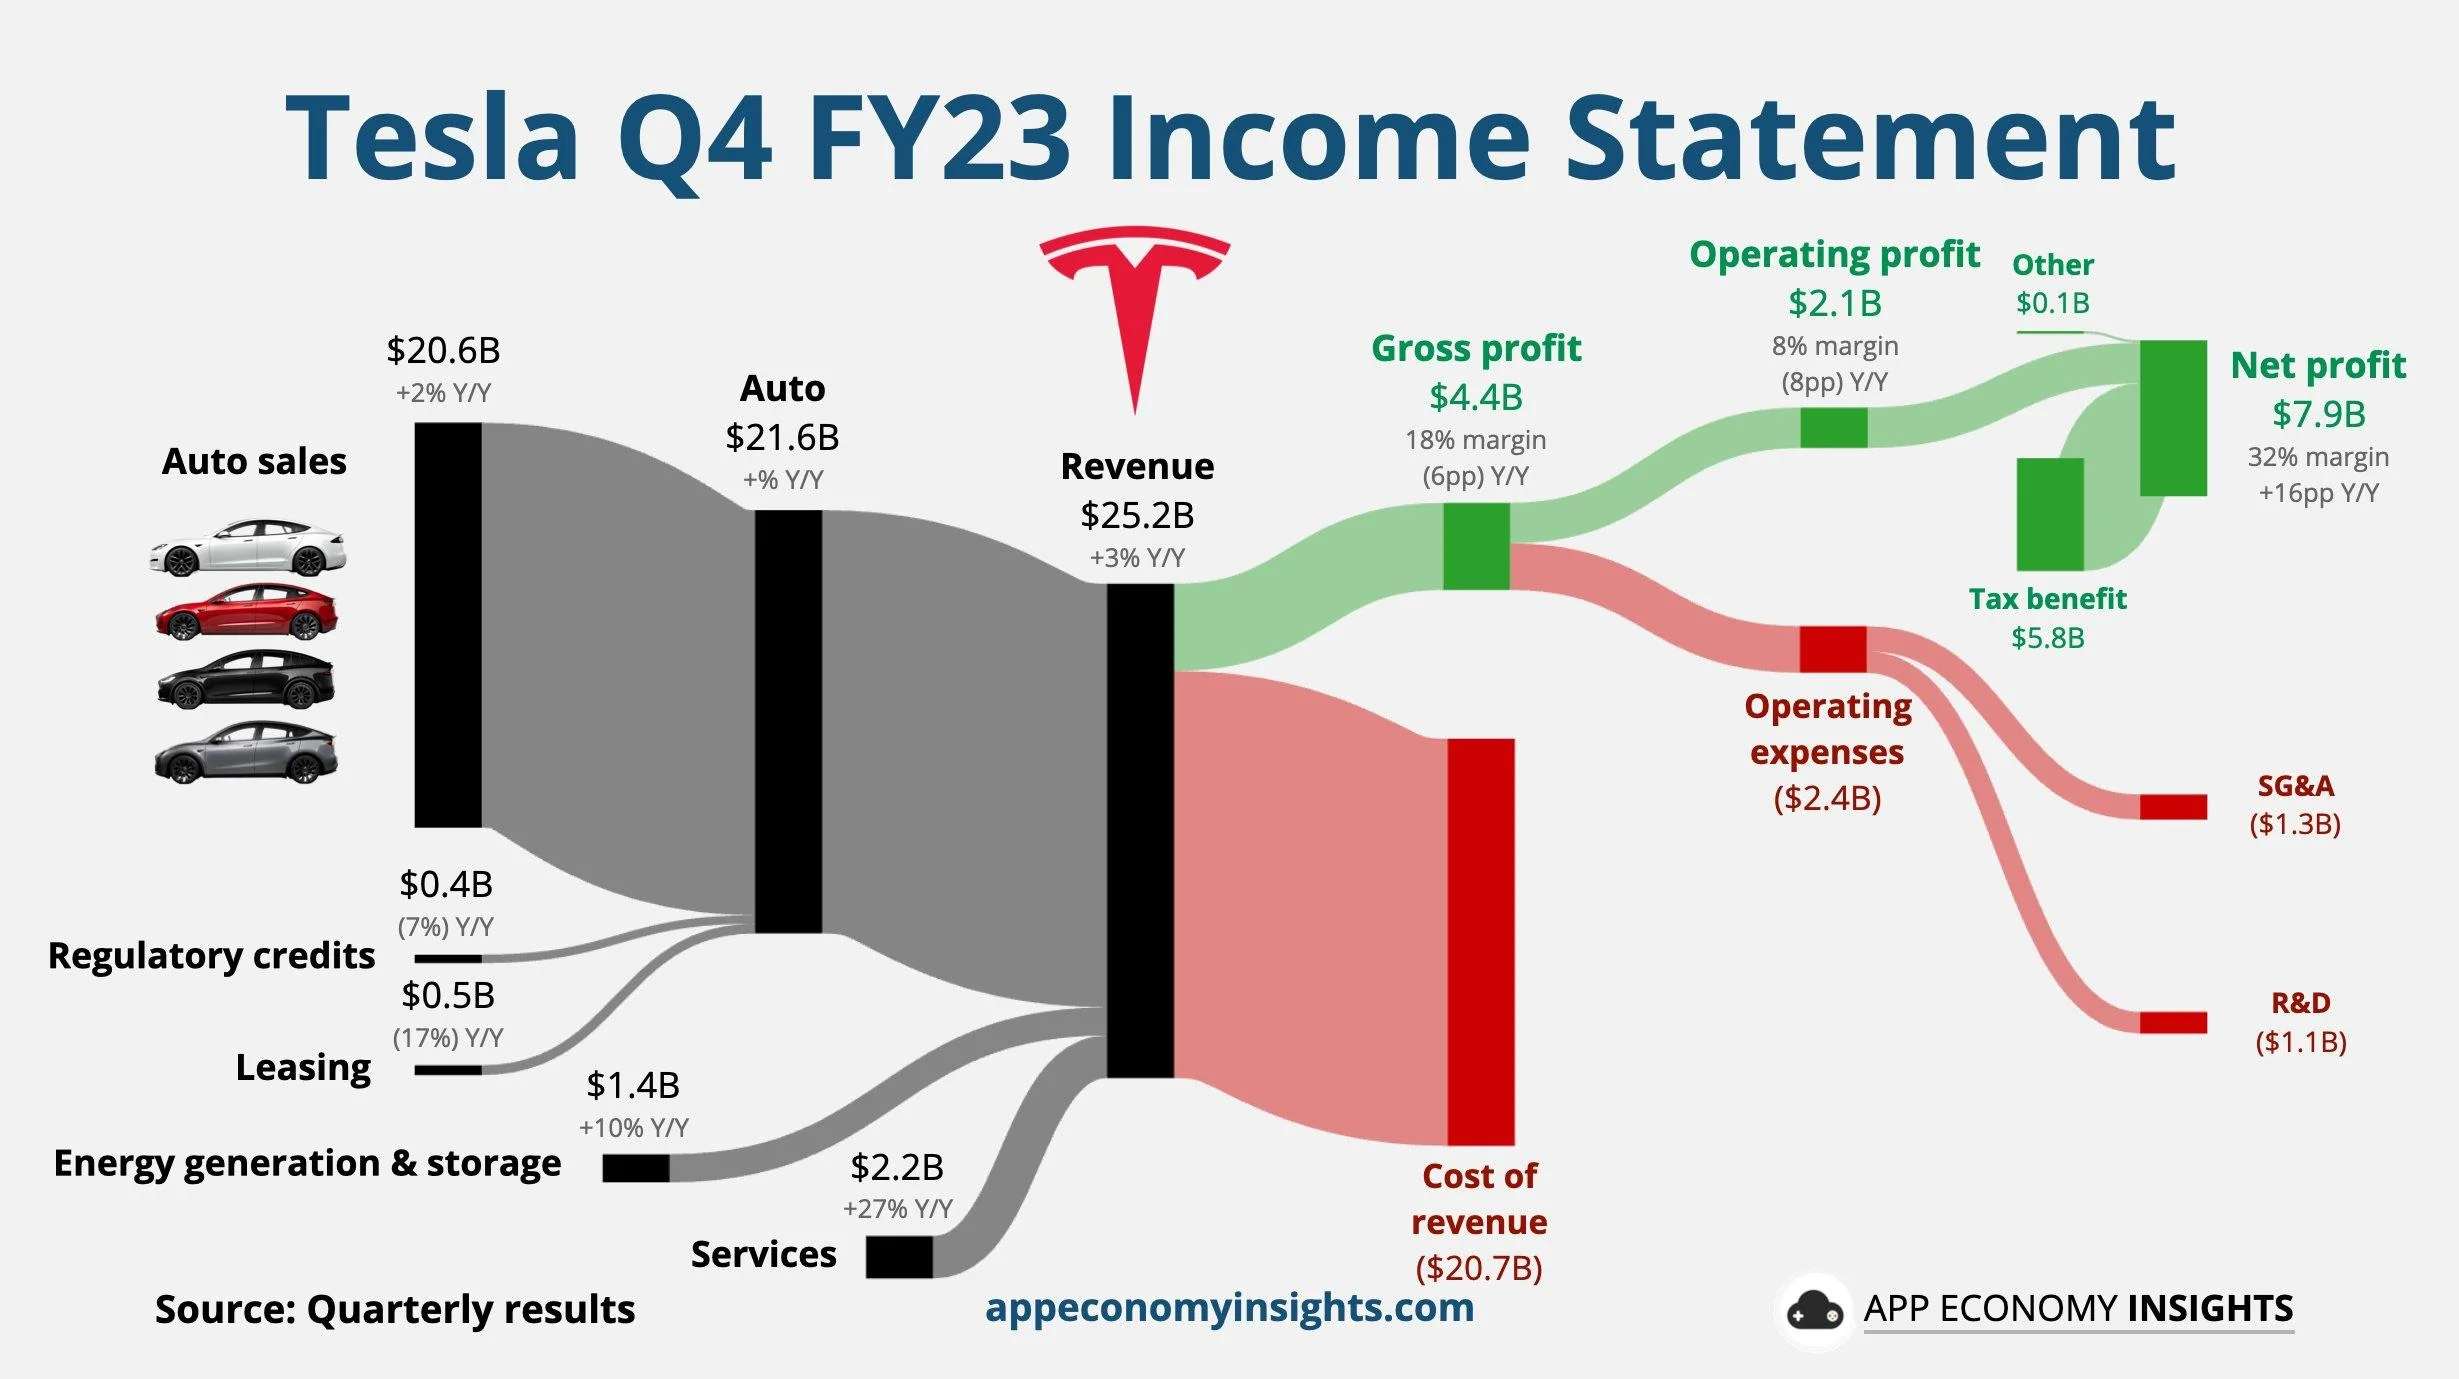
— 2024-09-26 – not just one, but 7 charts showing how various tech companies make money. i love these sorts of charts…
— 2024-09-21
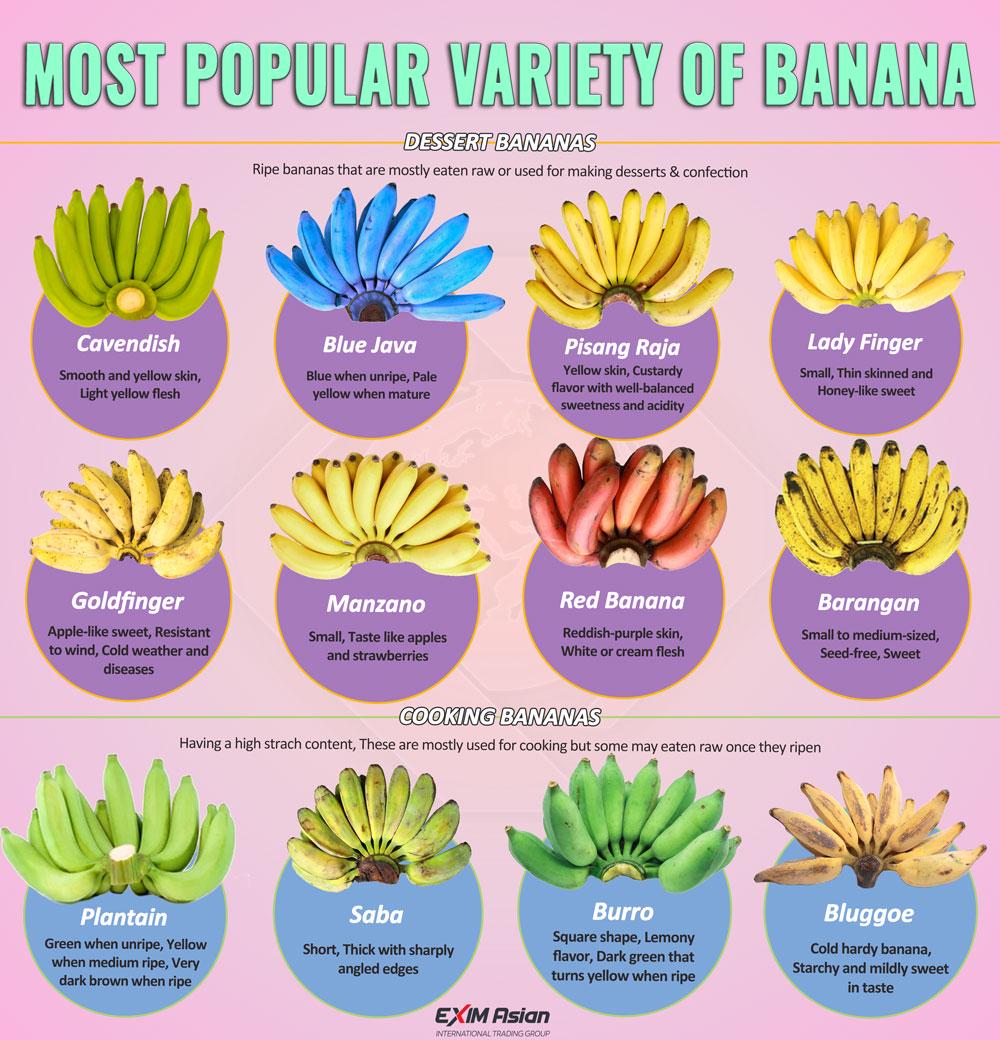
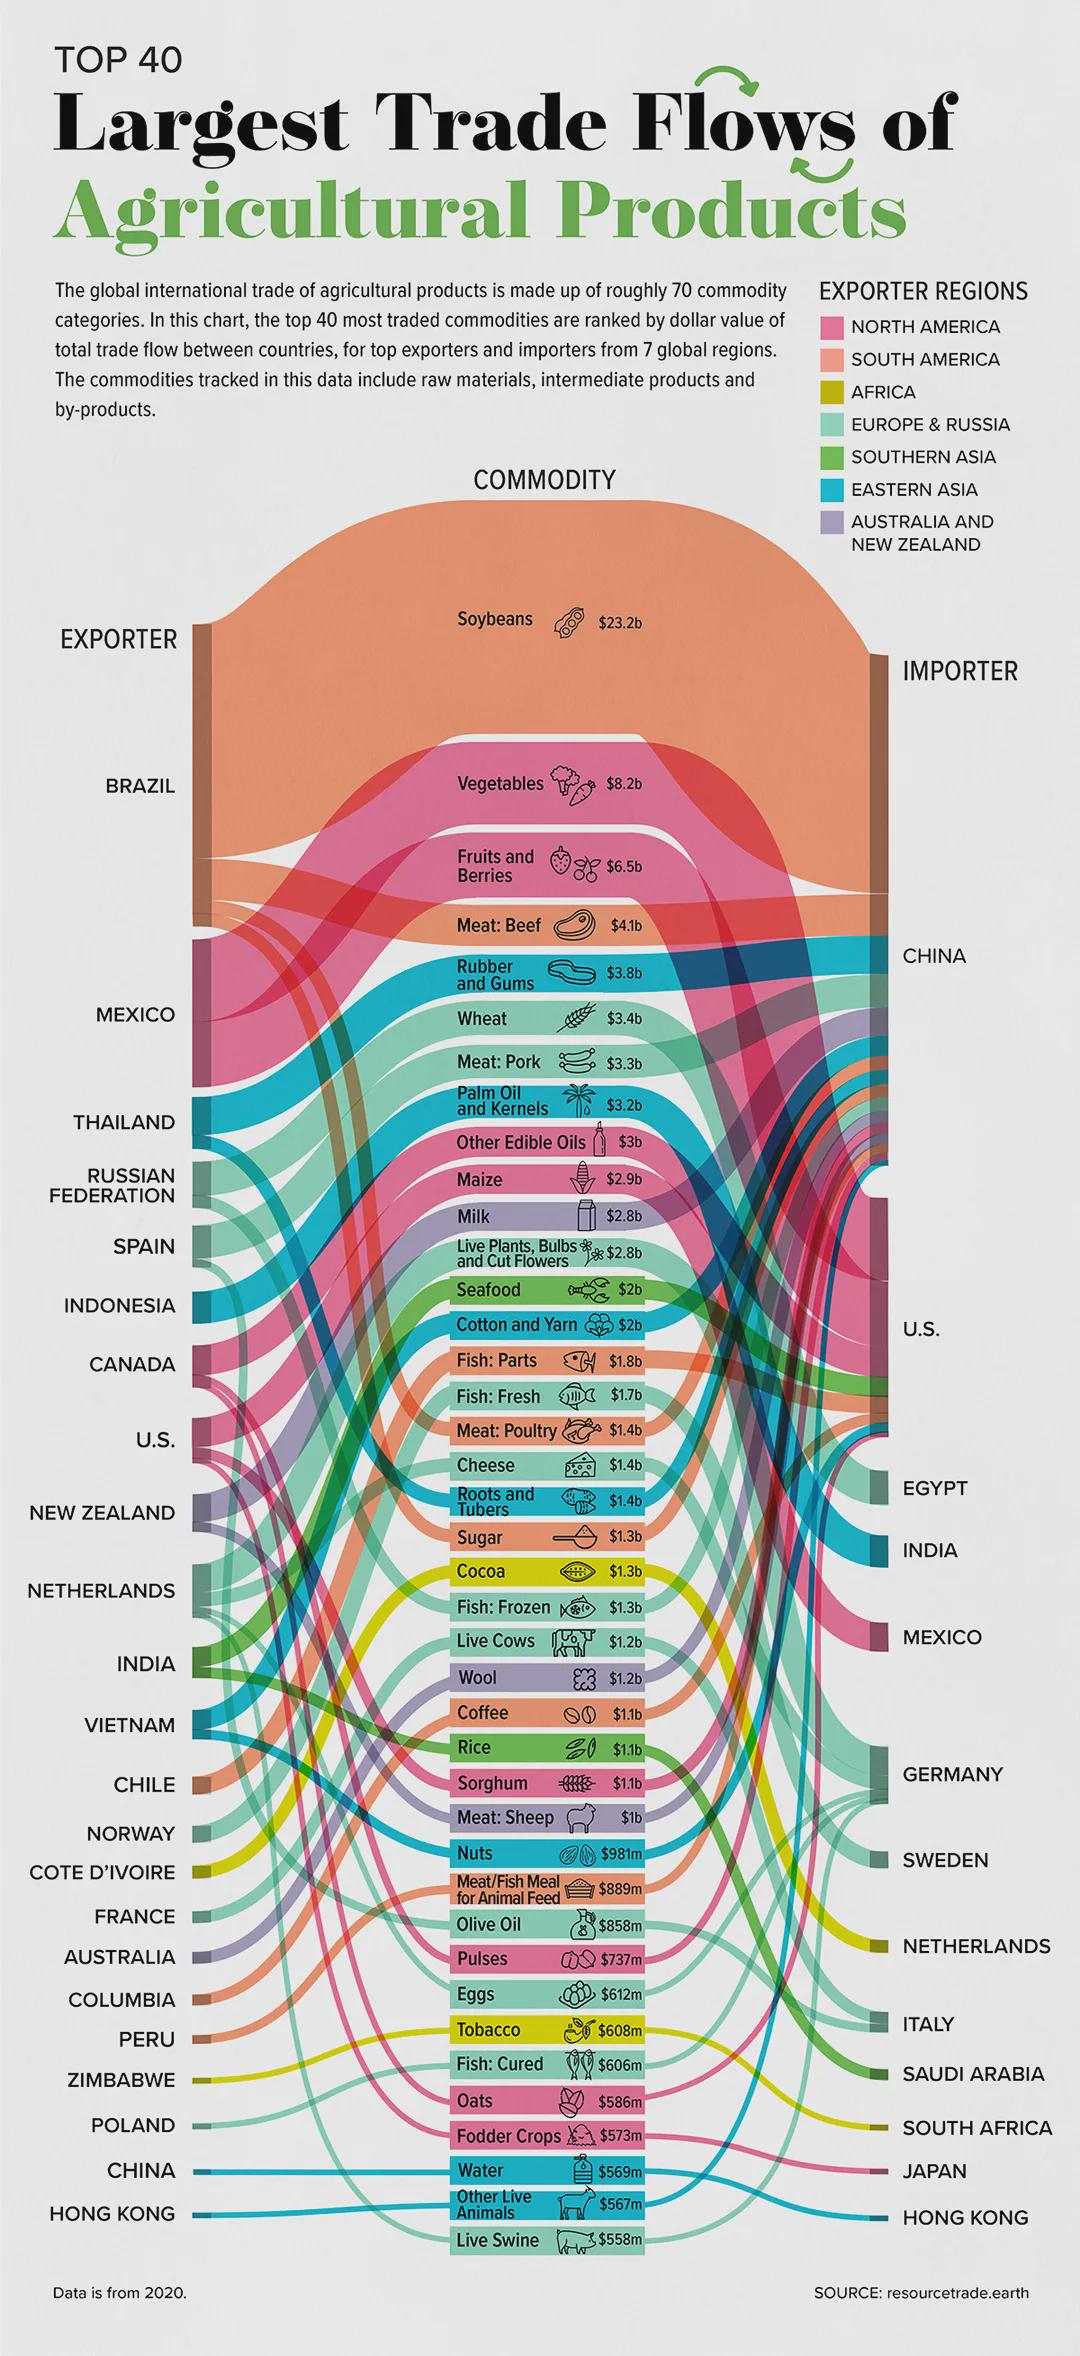
— 2024-08-11 – while the global supply chain is amazing, providing us canadians with bananas at~0.75$/lb, and they’re OK, we are a bit impoverished in the types we have avail.