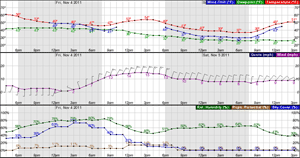
this chart is interesting, but unless one knows the normal or average or year-over-year numbers, i have no idea if this is good or bad. there are alway wildfires, dozens to hndreds.
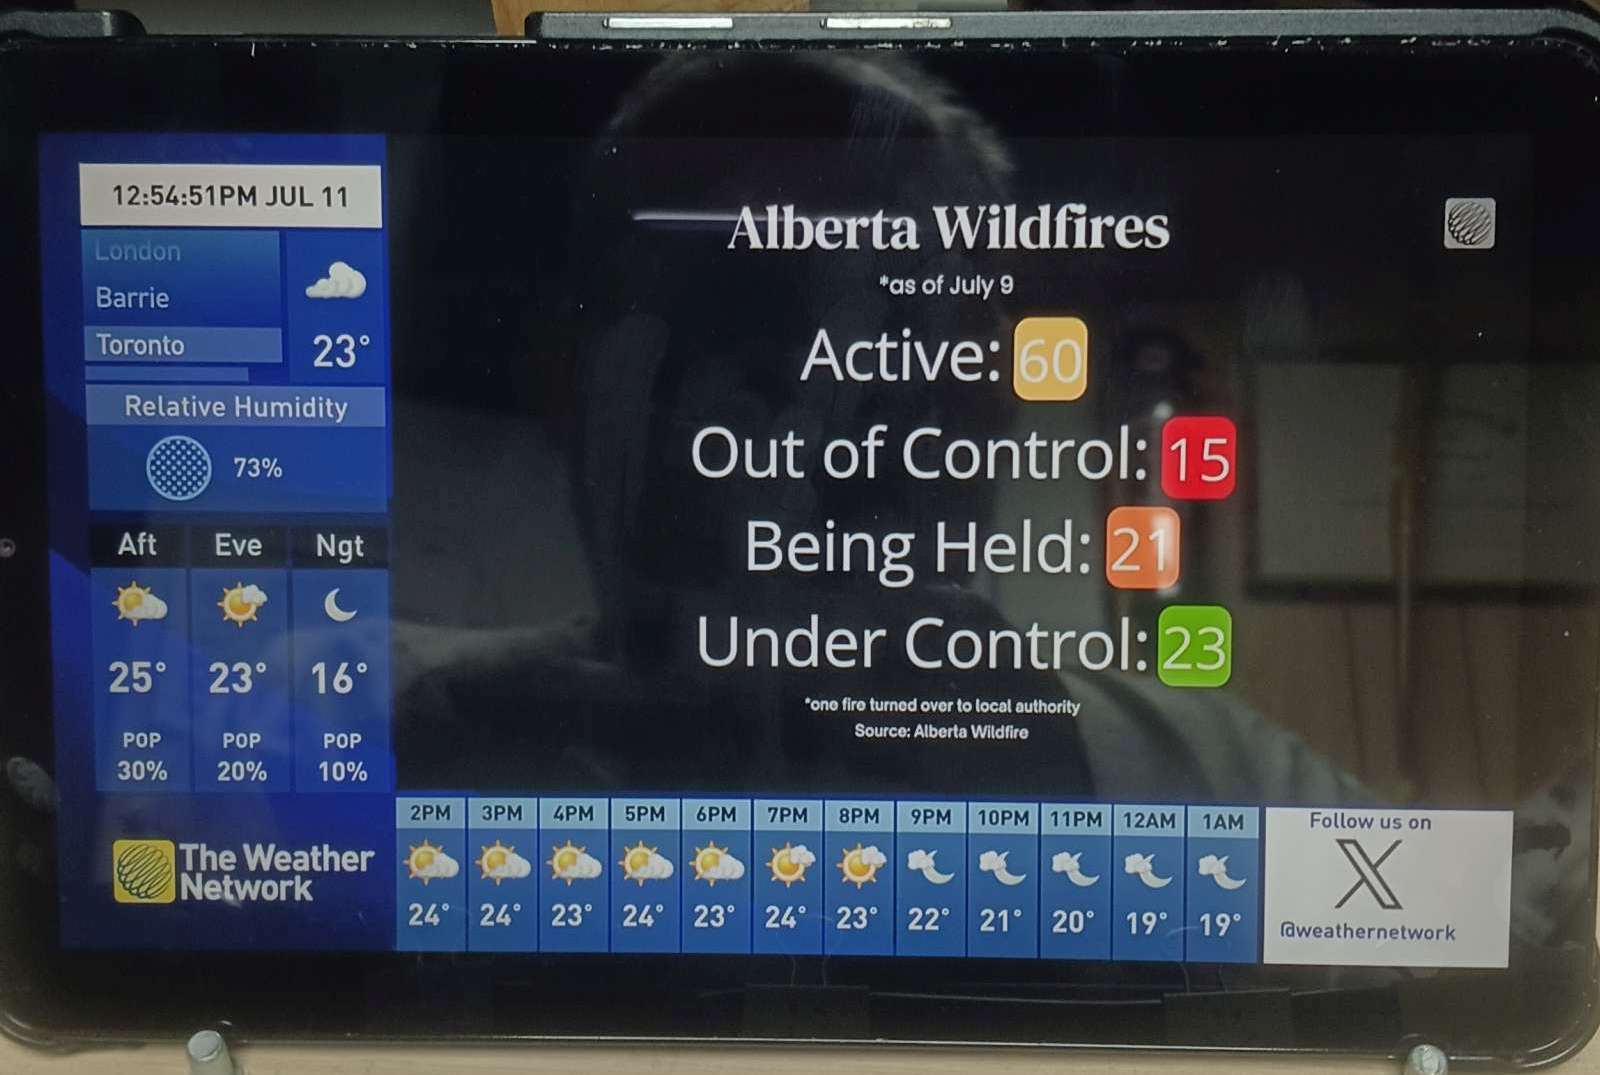
this is better, although could be improved by making the backgroud colour of the “now” column constant , with red/yellow/green being used for the relative numbers (red for large+, green for large -, yellow for small deviations from 0)
… and this is even better; perctanges give an instant “how is this year doig, wilfrei-wise”:
ne3ed to make graphic using ercentages instead of numbers. but why?