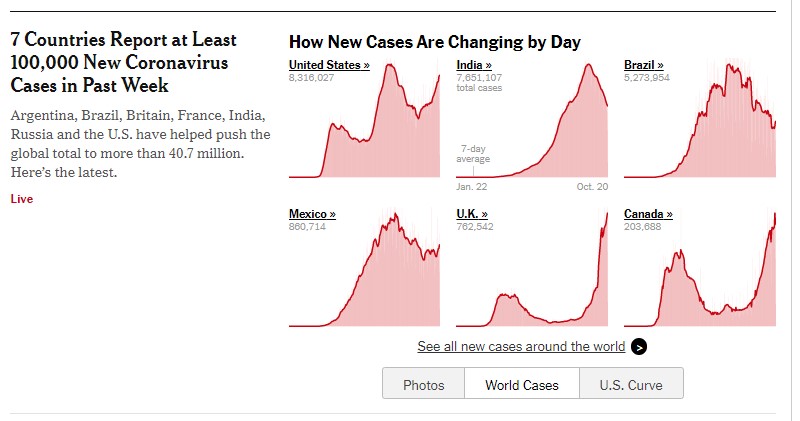
Front page, 2020-10-21; should be plotted to same scale, which would highlight the abject failure of the USA. Of course, shoudl be per capita, not absolute numbers.
Sent this email to NYT:
To the Editor:
Your graphic titled “How New Cases Are Changing by Day” (see attached) is terribly misleading. It suggests the scale of the problem is similar across the the six countries shown. If you’re going to use total cases, then you must use the same vertical scale. This would highlight the abject failure of the US response to the pandemic.
Of course, the proper way to show this data is per capita. This would further show the abject failure of the US response.
Respectfully submitted for publication.
Cedric Silvester
35 Springbrook Dr.
PETERBOROUGH, ONT.
K9J 1L3